Figure 4.
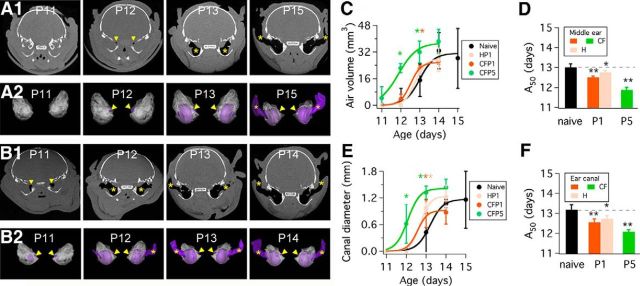
Anatomical changes in naive, HP1, CFP1, and CFP5 pups. A1, Micro-CT x-ray scans of naive pups from ages P11–P15. Gray represents soft tissue, white represents bone, and black represents air in the middle ear and auditory canal (indicated by yellow arrowheads and asterisks). A2, 3D reconstructions of left and right ear scans of animals shown in A1. The presence of small air pockets (purple) next to the medial wall of the middle ear cavity is noticeable at P12 (yellow arrowheads). At P13, middle-ear cavitation is complete, and at P15 air is observed in the ear canal (yellow asterisks). B1, Micro-CT x-ray scans of CFP5 pups from ages P11–P14. B2, 3D reconstructions of scan data shown in B1. The presence of small air pockets (purple) next to the medial wall of the middle ear cavity is noticeable at P11 (yellow arrowheads). At P12, middle-ear cavitation is complete, and at P14 air is observed in the ear canal (yellow asterisks). C, Measurements of air volume in the middle ear obtained from the micro-CT x-ray scans such as those shown in A and B. D, Summary of A50 values obtained from fitting data in C to Equation 1 (see Materials and Methods). E, Micro-CT x-ray scan data measurements of auditory canal diameter obtained from micro-CT x-ray scans such as those shown in A and B. F, Summary of A50 values obtained from fitting data in E to Equation 1 (see Materials and Methods). Dashed line represents naive A50 value in D and F, which is also shown as a black bar. Asterisks indicate statistical differences compared with naive data (*p < 0.01; **p < 0.001). Error bars in C and E represent SD; error bars in D and F represent SEM.

