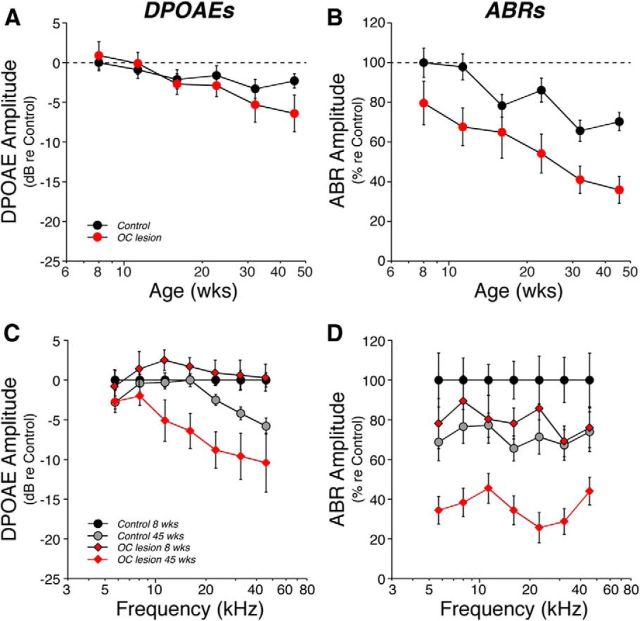
Figure 5.
Age-related decrements in cochlear response amplitudes were more pronounced in de-efferented regions, especially as measured via ABRs. Suprathreshold response amplitudes vs age (A, B) or frequency (C, D) for each group as seen via DPOAEs (A, C) or ABRs (B, D). For each measure, responses at 60–80 dB SPL were averaged and normalized with respect to the mean values for 8 week Controls. For A and B, responses were averaged across all frequencies. C, DPOAE differences between the OC Lesion group at 45 weeks and age-matched controls were significant at the p < 0.01 level for 16, 22.6, and 32 kHz, and at the p < 0.05 level for 11.3 kHz. D, Differences between the OC Lesion group at 45 weeks and age-matched controls were significant at the p ≪ 0.01 level for all frequencies except 11.3, which was significant at the p < 0.05 level. For ABRs, only the amplitude of Wave 1 was considered. OC Lesion group is defined as described in Figure 3A. Group sizes are as described in Figure 3. All data are group means (±SEM).

