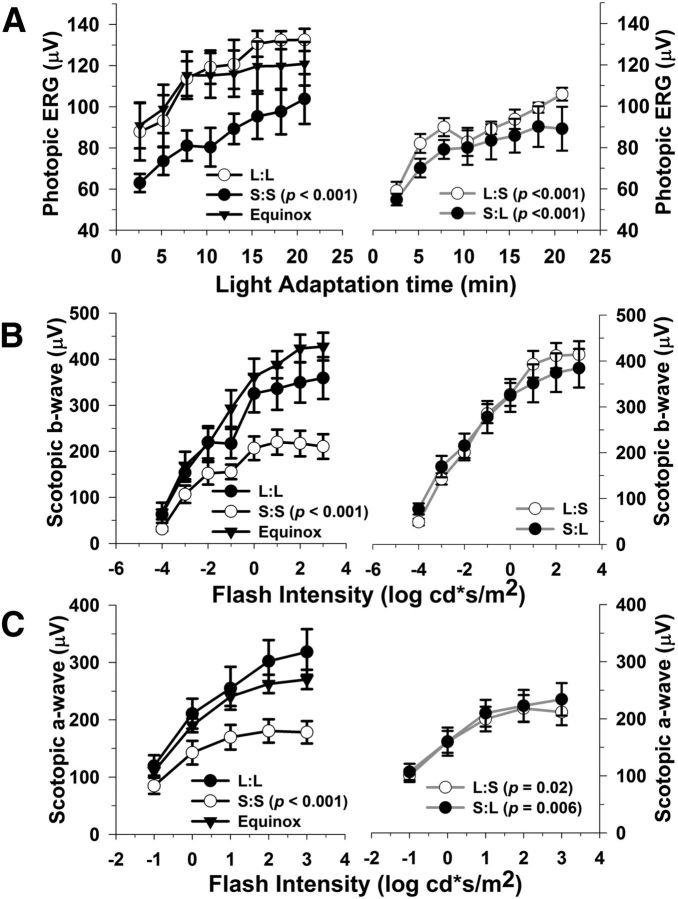
Figure 2.
Photoperiod affects light- and dark-adapted retinal function. A, Light-adapted (photopic) b-wave amplitudes are significantly lower in mice exposed to S:S, L:S, and S:L photoperiods as compared with L:L (p < 0.001, all groups). B, Dark-adapted (scotopic) b-wave amplitudes are significantly reduced in the S:S mice compared with the L:L group (p < 0.001). In contrast, the L:S and S:L groups do not differ from L:L; however, they are significantly higher in amplitude compared with S:S mice (p < 0.05, both comparisons). C, Dark-adapted (scotopic) a-wave amplitudes are lower in the S:S, L:S, and S:L groups in relation to L:L mice (p = < 0.001, 0.022, 0.006, respectively). Also, the L:S and S:L groups significantly differ in amplitude compared with S:S mice (p = 0.018 and 0.024, respectively). All data points represent means ± SEM; n = 6–10.

