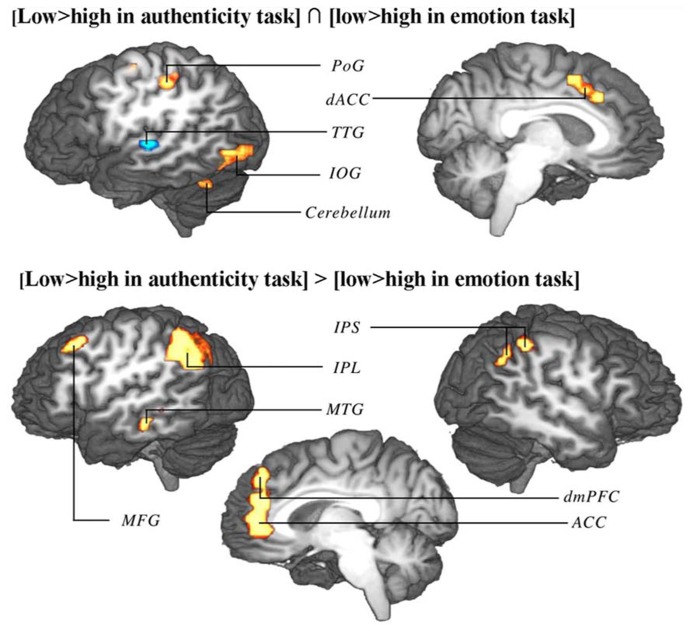
FIGURE 5.
Conjunction (top) and disjunction (bottom) of brain activation correlates of contour in authenticity task trials of study 1 and emotion task trials of study 2. Top: regions marked red up-regulated by low contour in both tasks, regions marked blue up-regulated by high contour in both tasks. Bottom: interaction of contour extremes and task type (regions up-regulated by one end of the contour range in one task and by the other end of the contour range in the other task). Shown are group-averaged statistical maps (study 1: n = 24; study 2: n = 18). Posterior probability maps with a threshold of 99.5% and 100 voxel minimum size. Activation was mapped onto the best average fit subject 3D anatomical map. Top: left view sagittal section. Bottom: left view sagittal section through midline. PoG, postcentral gyrus; dACC, dorsal anterior cingulate cortex; TTG, transverse temporal gyrus; IOG, inferior occipital gyrus; IPS, inferior parietal sulcus; IPL, inferior parietal lobule; MTG, middle temporal gyrus; MFG, middle frontal gyrus.

