
Figure 3.
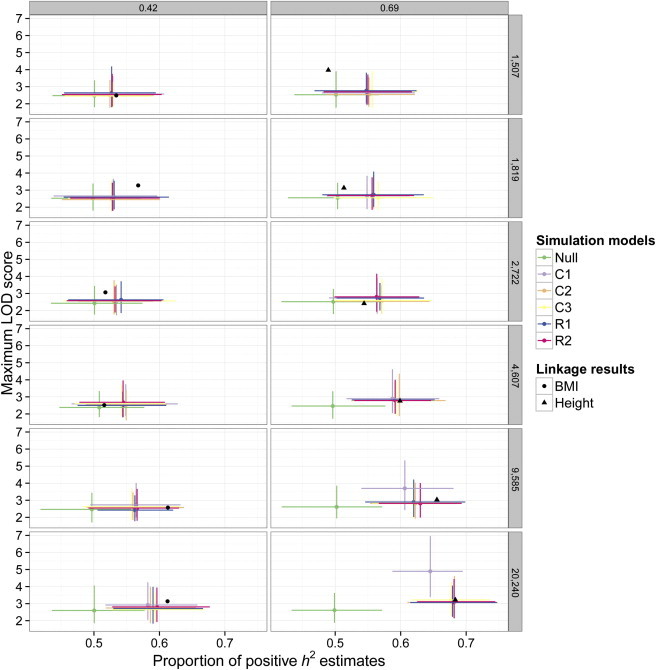
Simulations of Genetic Effect Models
Expected results for various polygenic models are compared to observed results from true linkage analyses. Maximum LOD scores (y axis) from linkage scans are plotted against (x axis). Rows of panels correspond to sample sizes, representing different cohort sizes (top five rows) and the combined data set (bottom row). Columns of panels correspond to simulated h2; the left column represents BMI, and the right column represents height. Each model × sample size × heritability combination was replicated 100 times, and error bars represent 95% confidence intervals. Genetic models are as follows: Null, no genetic effects; C1, oligogenic where a single common QTL exists per chromosome; C2, polygenic with common SNPs uniformly distributed throughout the genome; C3, polygenic with common SNPs clustering across the genome; R1, polygenic with rare SNPs uniformly distributed throughout the genome; and R2, polygenic with rare SNPs clustering across the genome. It is shown that different polygenic architectures have nearly identical properties in linkage analysis and that they are consistent with the results for BMI and height.