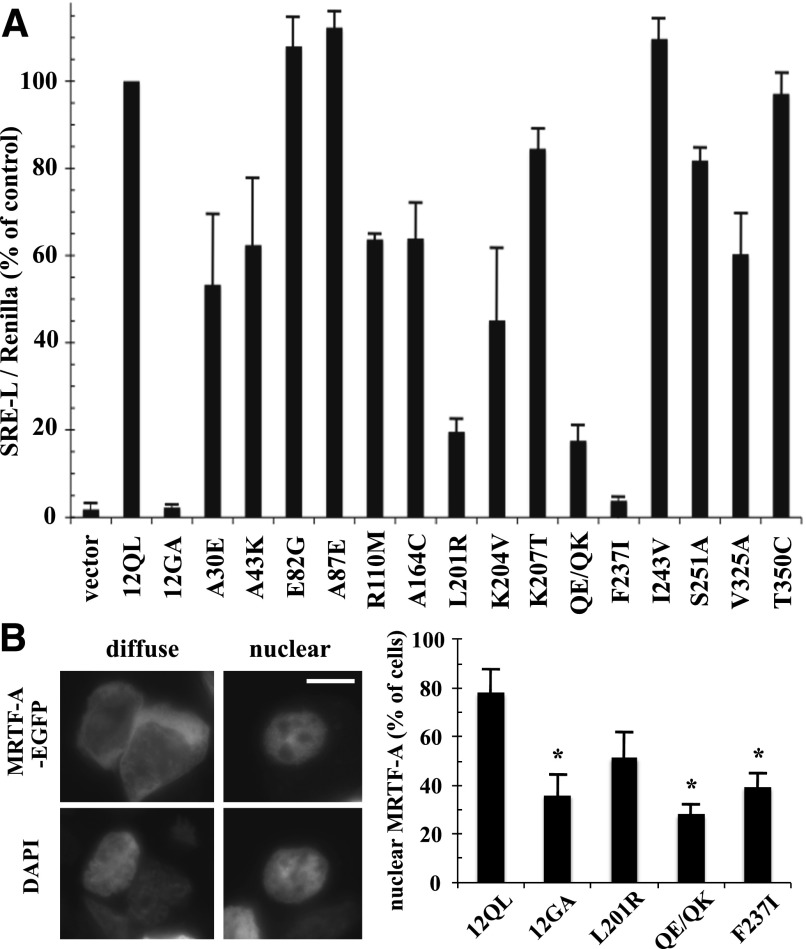
Fig. 2.
Identification of class-distinctive mutants of Gα12 impaired in SRE-mediated transcriptional activation. (A) HEK293 cells were transfected with the plasmids SRE-luciferase (0.2 µg) and pRL-TK (0.02 µg) plus 1 µg of plasmid encoding each indicated class-distinctive mutant of myc-Gα12QL (x-axis). Firefly luciferase activity values were normalized for Renilla luciferase activity values and presented as a percent of positive control myc-Gα12QL (12QL) within the same experiment. Empty pcDNA3.1 (vector) and Gα12 harboring the inactivating G228A mutation (12GA) were examined as negative controls. Data presented are the mean ± range of two independent experiments per myc-Gα12QL variant, with three or more experiments performed for mutants that showed greater than 50% impairment of SRE stimulation. (B) HEK293 cells grown in six-well plates were cotransfected with 1.0 µg of EGFP-MRTF-A plasmid and 1.0 µg of each indicated Gα12 construct. Cells (50 per transfection) were scored for either diffuse or exclusively nuclear localization of the EGFP signal, using 4′,6-diamidino-2-phenylindole (DAPI) costaining to define the boundaries of the nucleus. Examples are shown in the left panels (two cells exhibiting diffuse EGFP-MRTF-A staining) and right panels (single cell exhibiting nuclear staining of EGFP-MRTF-A). Scale bar is 10 µm. The column graph shows results compiled from three independent trials, presented as mean ± S.E.M. Significance of the difference in mutant values compared with positive control (12QL) was determined by Student’s t test (*P < 0.05).

