Fig. 6.
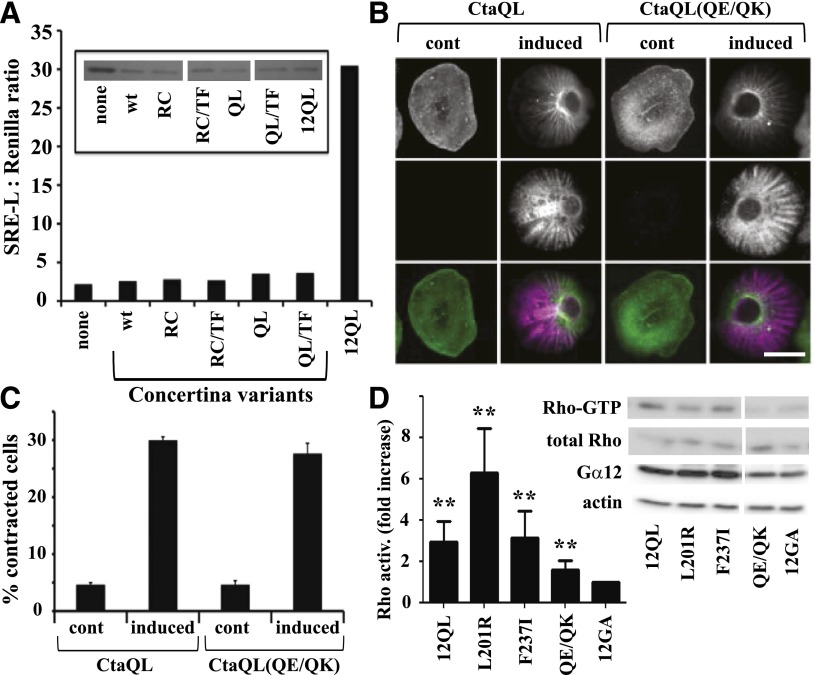
Differential effects of Gα12 and Concertina on SRE-mediated transcription and cytoskeletal rearrangements. (A) Effect of Concertina variants on SRE-mediated transcriptional activation. HEK293 cells were transfected with a GFP-encoding IRES vector harboring myc-Gα12QL (12QL), no additional coding sequence (none), or Concertina variants with the following designations: wt, wild-type; RC, R277C; QL, Q303L; TF, T311F. For each sample, luciferase assays were performed (graph) and GFP levels were determined by immunoblot analysis (inset) to allow indirect measure of expression of Concertina variants. Data shown are a representative of three independent experiments. (B) Effect of Concertina and its Q306E/Q308K variant on cell contraction. S2 cells expressing inducible myc-tagged, constitutively active Concertina (CtaQL) or the same protein harboring Q306E/Q308K substitutions (QE/QK) were induced with 50 µM copper sulfate and 24 hours later scored for contractility as described in Materials and Methods. Cells were stained with phalloidin (top row) and anti-myc antibody (middle row), and images were merged (bottom row). Scale bar is 10 µm, and images are from a representative of three independent experiments. (C) Compiled quantitative data from experiments described in (B) are shown, with bars indicating S.E.M. (D) HEK293 cells were assayed for basal RhoA activity 36–42 hours after transfection with constitutively active (12QL) or inactive (12GA) myc-tagged Gα12, or the indicated mutants of myc-Gα12QL. Blots were developed with SuperSignal West Pico chemiluminescent substrate (Pierce, Rockford, IL) and Kodak Biomax film, and representative blots of active RhoA (Rho-GTP) precipitated by GST-RBD versus total RhoA in cell lysates are shown, along with blots of Gα12 and actin in the same experiment. RhoA activity is the ratio of active RhoA to total RhoA signal, with densitometry (NIH ImageJ software) used to quantify results from seven independent experiments. Results are graphed as the -fold increase over cells expressing inactive, GDP-bound Gα12 (12GA). Graphical data represent mean ± S.E.M.; **P < 0.001 as calculated through analysis of variance using the Kruskal–Wallis test.

