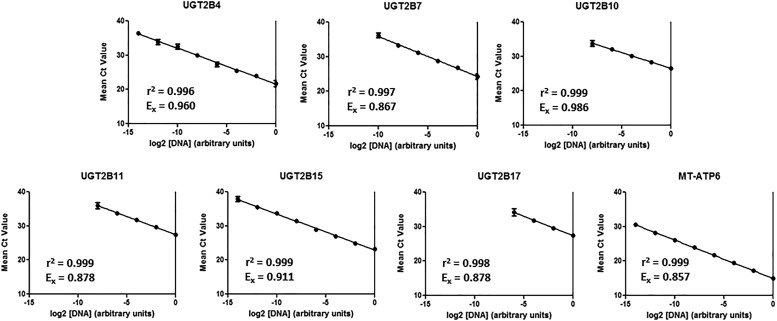
Fig. 1.
UGT2B and MT-ATP6 qPCR standard curves. Pooled cDNA from three liver samples was subjected to a serial 4-fold dilution prior to real-time PCR amplification. The efficiency values of each of the real-time PCR assays was calculated with the formula Ex=[2(–1/slope) – 1] as described in Materials and Methods. Average Ct values were calculated by taking the arithmetic mean of four replicate data points. Data are reported as mean ± standard deviation.

