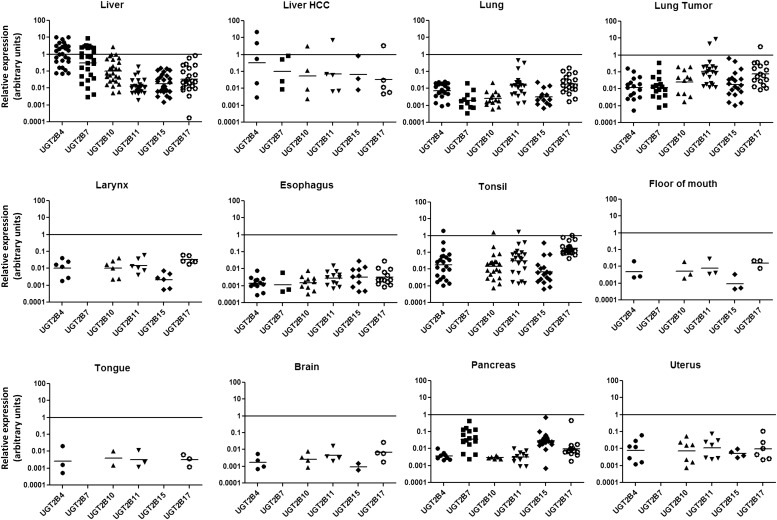
Fig. 3.
Relative expression levels of individual UGT2B genes across different tissues. UGT2B mRNA expression levels were assessed in 113 normal tissue specimens. The log of the relative expression levels for the UGT2B genes is shown. The relative abundance was calculated via the 2–ΔΔCt method with the geometric mean of the highest expressing tissue set as the calibrator.

