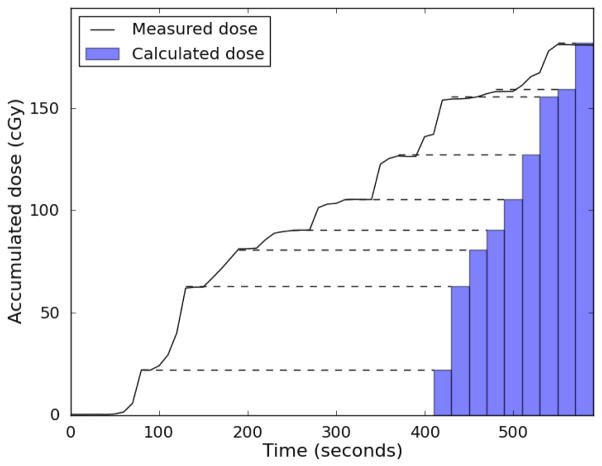
Figure 7.
PSD measured real-time dose. The accumulated dose measured by one of the plastic scintillation detector is plotted in black. The treatment planning system allows the cumulative dose-per-beam to be extracted (represented by blue bars at right), but not the cumulative dose as a function of time. Dashed lines between the measured dose and the bars are meant to facilitate comparison. Between beams when there is no radiation, the measured dose profile is flat. If the detector is measuring dose accurately, these plateaus in the dose profile should agree with the cumulative beam-by-beam dose. As can be seen, these plateaus agree excellently with the cumulative doses calculated by the treatment planning system, indicating good beam-by-beam agreement between the plastic scintillation detector and treatment planning system.

