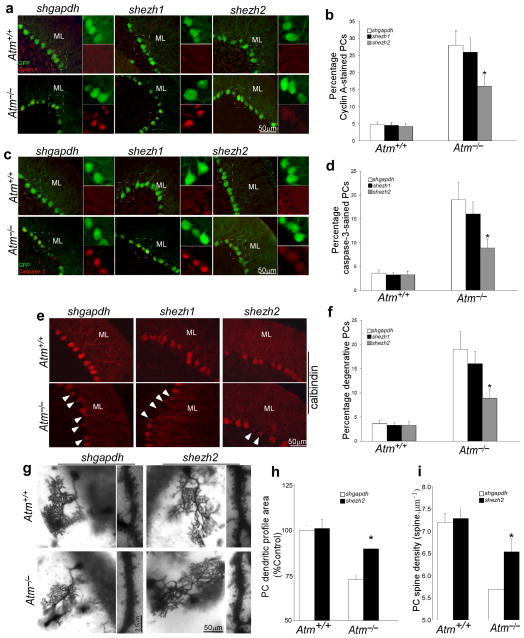
Figure 6. Knockdown of EZH2 prevents neurodegeneration of Atm−/− mice.
a) Representative images of cyclin A- and GFP-stained PCs show the effects of knockdown of ezh2. Scale bar, 50 μm.
b) Quantification of the cyclin A staining shown in panel a). Each bar represents the average of three independent experiments. Error bar = SEM.
c) Representative images of cleaved caspase-3- and GFP-stained PCs show the effects of knockdown of ezh2.
d) Quantification of the staining shown in panel c). Each bar represents the average of three independent experiments. Error bar = SEM.
e) Representative images of calbindin-stained PCs show the effects of knockdown of ezh2. The white arrows mark degenerating PCs with atrophy. Scale bar = 50 μm.
f) Quantification of the staining shown in panel e). Each bar represents the average of three independent experiments. Error bar = SEM.
g) Representative Golgi-stained images of the dendritic arbors and distal spine density of PCs show the effects of lentiviral delivery of shezh2 on degenerative progression in Atm−/− cerebellum.
h–i) Quantitative assessments of dendritic profiles and density of PCs shown in panel g). There were significant differences in PCs dendritic profile areas (ANOVA; F(2,14) = 3.6; p< 0.005) and spine density (ANOVA: F(2,14) = 18.7; p< 0.01) between wild type and Atm−/− mice. The dendritic profiles (F(2,14) = 6.7; p< 0.005) and spine density (F(2,14) = 13.6; p< 0.01) of Purkinje cells in Atm−/− mice with shezh2 infection was significantly increased. The counted PCs cell numbers: nAtm+/+&shgdph = 26, nAtm−/−&shgdpah = 29, nAtm+/+&shezh2 = 27, nAtm−/−&shezh2 = 31.
Each bar represents the average of three independent experiments. Error bar =SEM.

