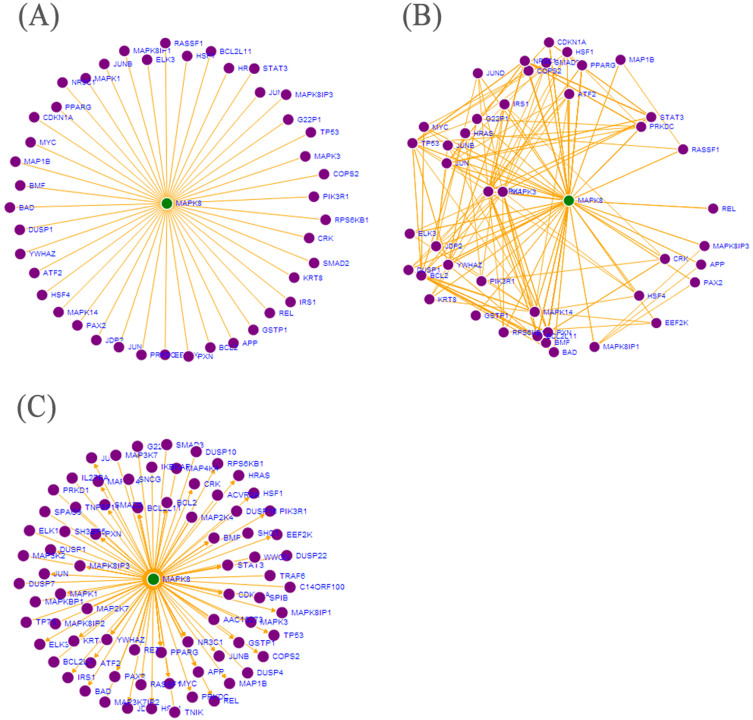
Figure 2. Network analysis of MAPK8 protein.
The green circle indicates the node protein. The purple circles indicate leaf proteins, and the orange lines indicate interactions. (A) The node network of MAPK8 protein. Fig. 3A shows the interactions of MAPK8 and 44 downstream proteins. (B) The leaf network of MAPK8 protein. The leafnet model in Fig. 3B is used to evaluate the interactions of downstream proteins. (C) The loop network of MAPK8 protein. The loopnet model in Fig. 3C shows the visualization of MAPK8 PPI network including downstream and upstream proteins that helps researchers to understand the mediated communication between interacted proteins.

