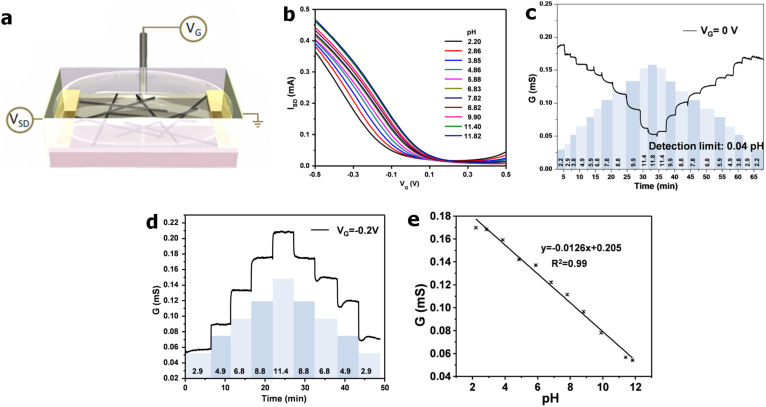
Figure 3.
(a), Schematic illustration of setup used for field-effect transistor (FET) characteristics measurements. A constant source drain voltage is applied across the nanotube network while the gate voltage (VG) is swept between −0.5 and +0.5 V. (b), FET transfer characteristics (i.e., source drain current (ISD) vs. applied liquid gate voltage (VG)) of a device functionalized by ox-SWNT/PAA exposed to various pH solutions. (c), Conductance (G) vs. time measurements of ox-SWNT/PAA device exposed to various pH solutions under a floating gate condition (pH values shown in banded bars). (d), Conductance vs. time measurements of the same device as in panel c under constant −0.2 V gate voltage, showing a reversed G ~ pH trend compared to panel c. (e), Calibration of G vs. pH for pH response shown in panel c.

