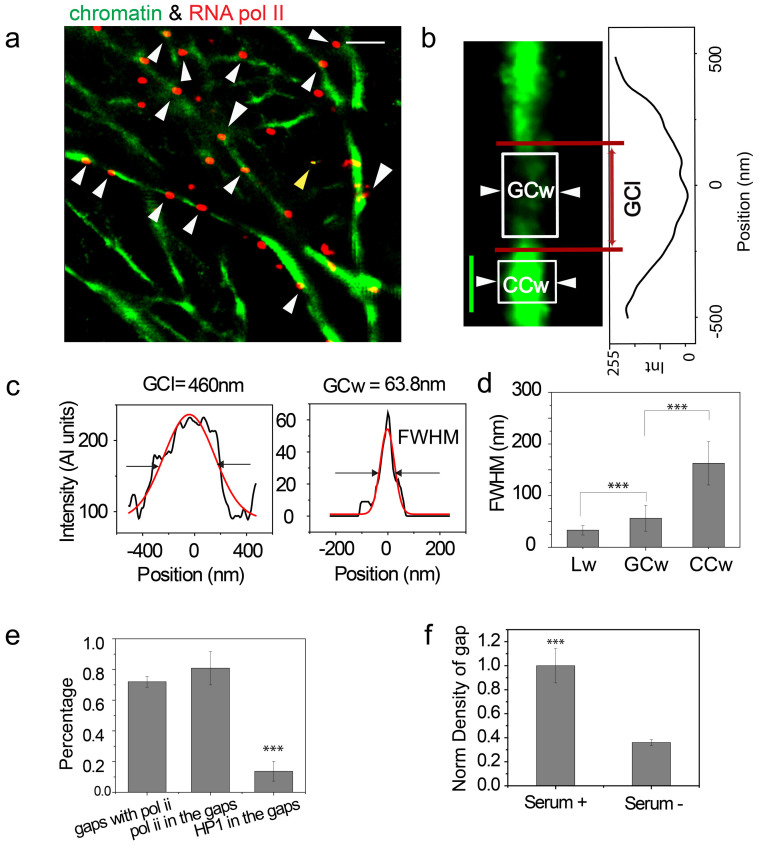
Figure 4.
BALM can detect the transcriptionally active regions|(a) Dual- color BALM image of chromatin (green) and RNA pol II (red). Scale bar: 1 μm. White arrows indicate the RNA pol II signals, which are in the gap structures. The yellow arrow indicates the tetraspeck beads. (b) A representative zoomed in BALM image of gap structure with an intensity line plot along the structure. Scale bar: 200 nm. (c) Representative line profile for the gap chromatin length (GCl) and gap chromatin width (GCw) denoted by the red lines and white boxes in (b). (d) Box plot of the λDNA widh (Lw) (n = 50), gap chromatin width (GCw) (n = 50), and condensed chromatin width (CCw) (n = 50) (***P < 0.001; Student's t-test). (e) Bar graph showing the percentage of gaps with RNA pol II, the percentage of RNA pol II sitting in gaps, and the percentage of HP1α sitting in gaps (n = 20) (***P < 0.001; Student's t-test). (f) Bar graph showing the normalized density of gap structures along 10-μm fibers in serum +/− conditions (n = 30) (***P < 0.001; Student's t-test).

