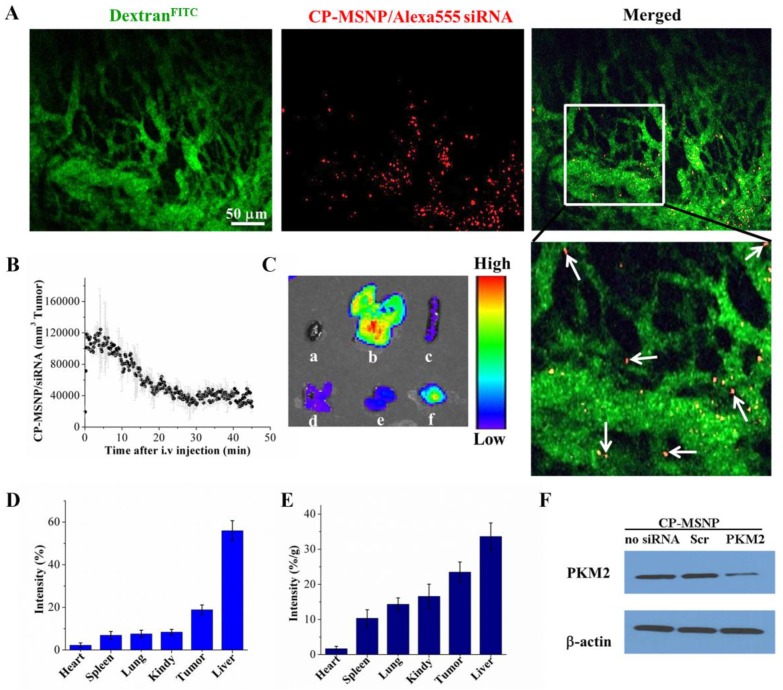
Figure 6.
In vivo evalution of CP-MSNP/siRNA tumor accumulation, biodistribution, and suppression of gene expression. (A) Intravital microscopic images captured one hour after administration of CP-MSNP/Alexa555. CP-MSNP/Alexa555 siRNA particles are shown in red, and tumor blood vessels are displayed in green (FITC-dextran). White arrows point to selected particles that have left the tumor vasculature. (B) Measurement of CP-MSNP/Alexa555 siRNA in tumor blood vessels at various time points by intravital microscopy. (C-E) Biodistribution of CP-MSNP/Alexa555 siRNA in tumor tissue and major organs. (C) Fluorescent intensity from tumor and major organs. Samples are presented as a: heart, b: liver, c: spleen, d: lung, e: kidney, and f: tumor. (D) Percentage of fluorescent intensity/sample and (E) percentage of fluorescent intensity/gram sample are presented. Percentage was calculated as fluorescent intensity in the sample/total combined intensity. (F) Western blot analysis on knockdown of PKM2 expression 5 days after treatment with CP-MSNP/siRNA (n = 3 mice/group).

