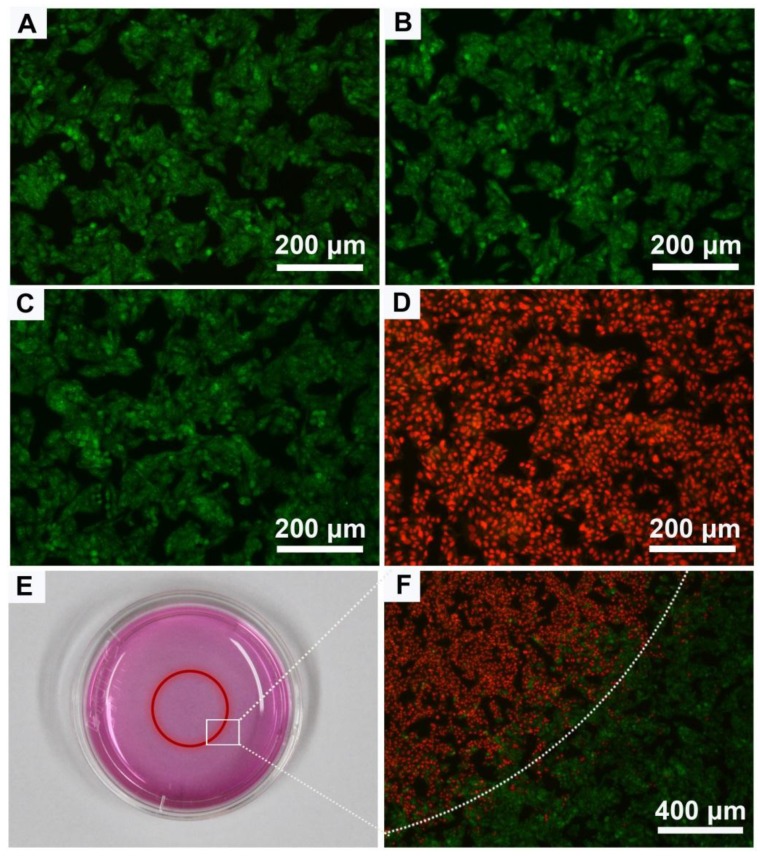
Figure 6.
The merged fluorescence microscope images of Hep G2 cells after different treatments: (A) blank control, (B) 100 μg/mL Au-80 CNAs only, (C) laser irradiation only, (D) combination of 100 μg/mL Au-80 CNAs and laser irradiation. (E) The photograph of cell culture dish of Hep G2 cells. The red circle shows the laser spot area. (F) The merged fluorescence image of Hep G2 cells after treatment with 100 μg/mL Au CNAs and laser irradiation in 3.5 cm dish. The cells are all co-stained by acridine orange (live: green) and propidium iodide (dead: red). Laser, 808 nm, 2 W/cm2 for 5 min.

