
Figure 1.
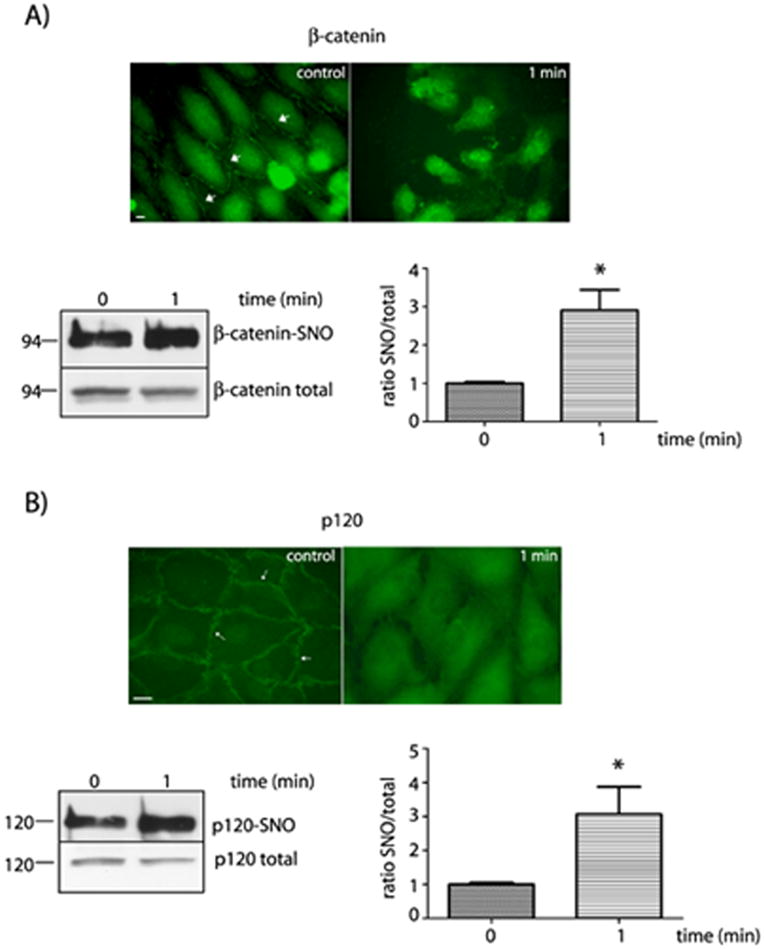
Correlation between protein organization at the cell membrane and SNO of β-catenin and p120 in CVEC. A) Upper Panel: Indirect immunofluorescence staining for β-catenin in control conditions and after stimulation with 10-7 mol/L PAF. Arrows indicate the presence of β-catenin in the cell plasma membrane. Bar represents 10 μm. Lower Panel: SNO of β-catenin as measured by biotin switch. The quantification is shown as the ratio of the S-nitrosylated β-catenin to the total β-catenin on the right lower panel. * P < 0.05 compared to control; n = 3. B) Upper Panel: Indirect immunofluorescence staining for p120 in control conditions and after stimulation with 10-7 mol/L PAF. Left lower panel: SNO of p120 detected by biotin switch. The quantification is shown as the ratio of the S-nitrosylated p120 to the total p120 on the right lower panel. *P < 0.05 as compared with control; n = 3.