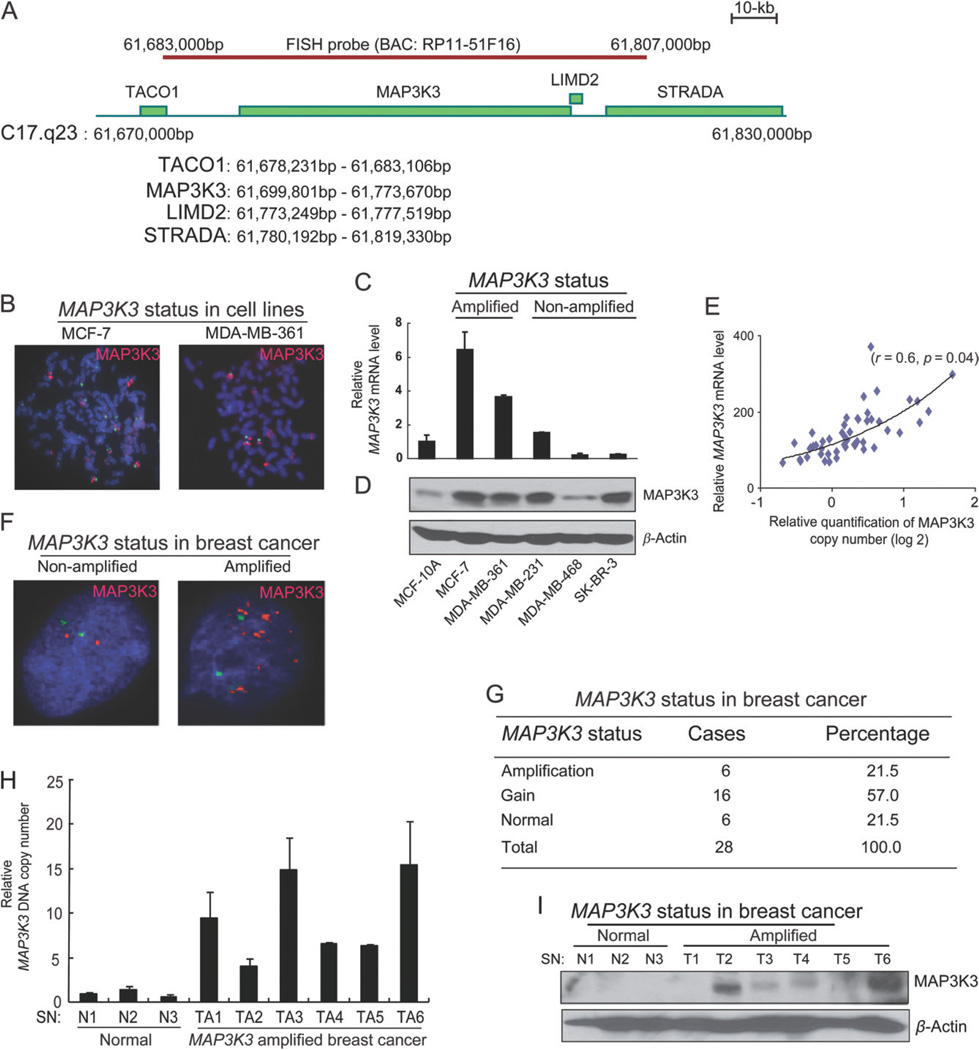
Figure 2.
MAP3K3 is amplified and over-expressed in a subset of breast cancers. (A) A schematic presentation of the BAC (RP11-51F16) FISH probe and the genes located within this probe. (B) FISH analysis of the indicated cell lines using the BAC probe (red) and a chromosome 17 centromere probe (pZ17-14, green). (C) Quantitative real-time RT–PCR showing MAP3K3 transcript levels, which were normalized to GAPDH and represented as fold-change relative to MCF-10A. Error bars represent SD from triplicate samples. (D) Immunoblotting analysis for MAP3K3 in the indicated cell lines. (E) The mRNA level of MAP3K3 positively correlates with its gene copy number in 51 breast cancer cell lines. (F) Representative images of FISH analysis of MAP3K3 in two primary breast cancers. (G) Summary of MAP3K3 status in 28 primary breast cancer specimens analysed by FISH. (H) The analyses of MAP3K3 DNA copy numbers by quantitative genomic PCR in primary breast cancers. (I) Immunoblotting analysis for MAP3K3 in normal breast tissue and breast cancers with MAP3K3 amplification.

