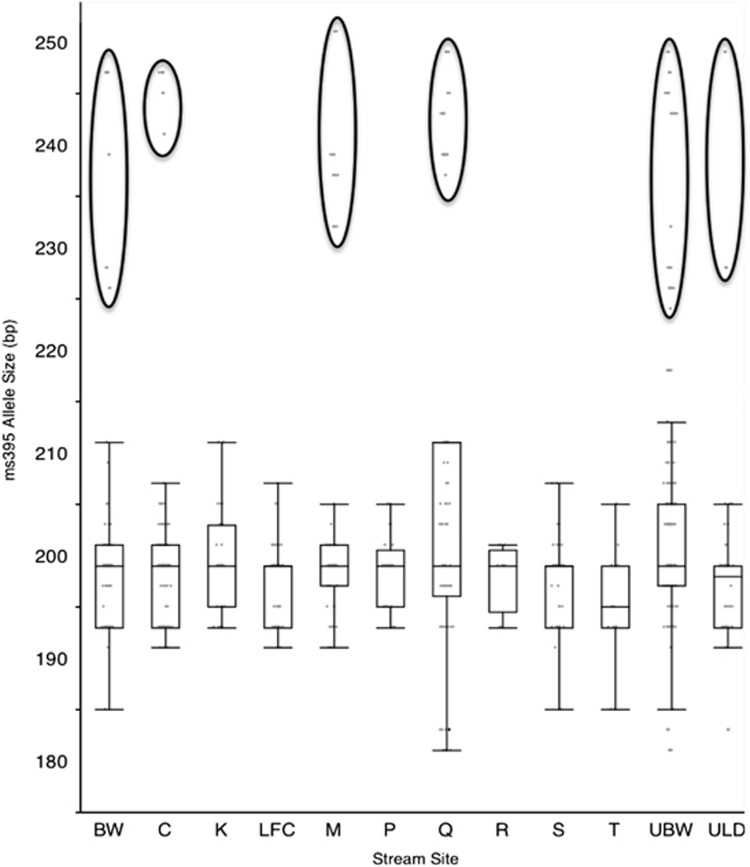
Figure 4.
Box plot (Q1, median, Q3) of ms395 allele sizes found at 12 sites along the Gombak valley (see Figure 1 for locations). Whiskers (Q1−1.5*interquartile range (IQR), Q3+1.5*IQR) show the spread of the allele sizes and outliers (mainly large alleles). Six of the 12 sites (circled) show the presence of large ms395 alleles (>218 bp), whereas the other six sites show a complete absence of large alleles.

