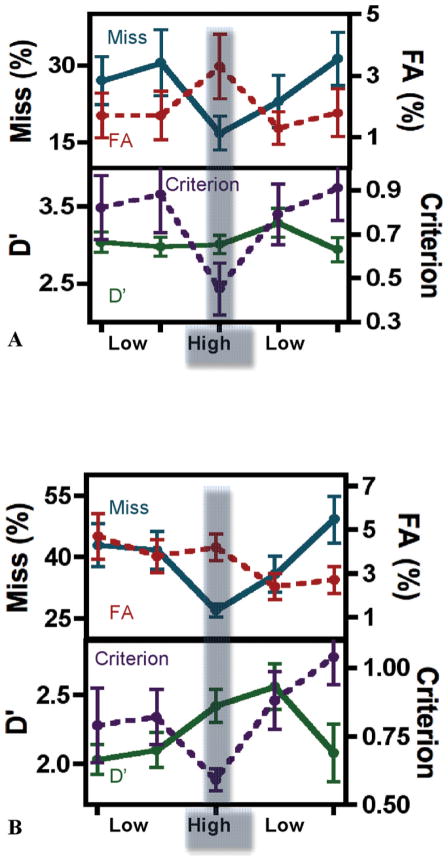
A and B, Top graphs are plots of average z-score false-negative results (blue solid line) and average z-score false-positive results (red dotted line) for low-target and high-target prevalence blocks. The bottom graphs are plots of average D′ (green solid line) and average c (criterion, purple dotted line) for blocks of low-target and high-target prevalence. A, Graphs depict data from the Boston, Massachusetts, study. B, Graphs depict data from the Cardiff, South Wales study. The 5 points on the graph represent data averaged over the 5 groups of blocks. The 5 groups of blocks are composed of 4 low-prevalence condition groups (each group is composed of 5 blocks of trials) and one high-prevalence block of trials. The error bars on the graphs are standard errors of the mean. Abbreviations: FA, false alarm or false-positive; Miss, false-negative, missed targets.

An official website of the United States government
Here's how you know
Official websites use .gov
A
.gov website belongs to an official
government organization in the United States.
Secure .gov websites use HTTPS
A lock (
) or https:// means you've safely
connected to the .gov website. Share sensitive
information only on official, secure websites.
