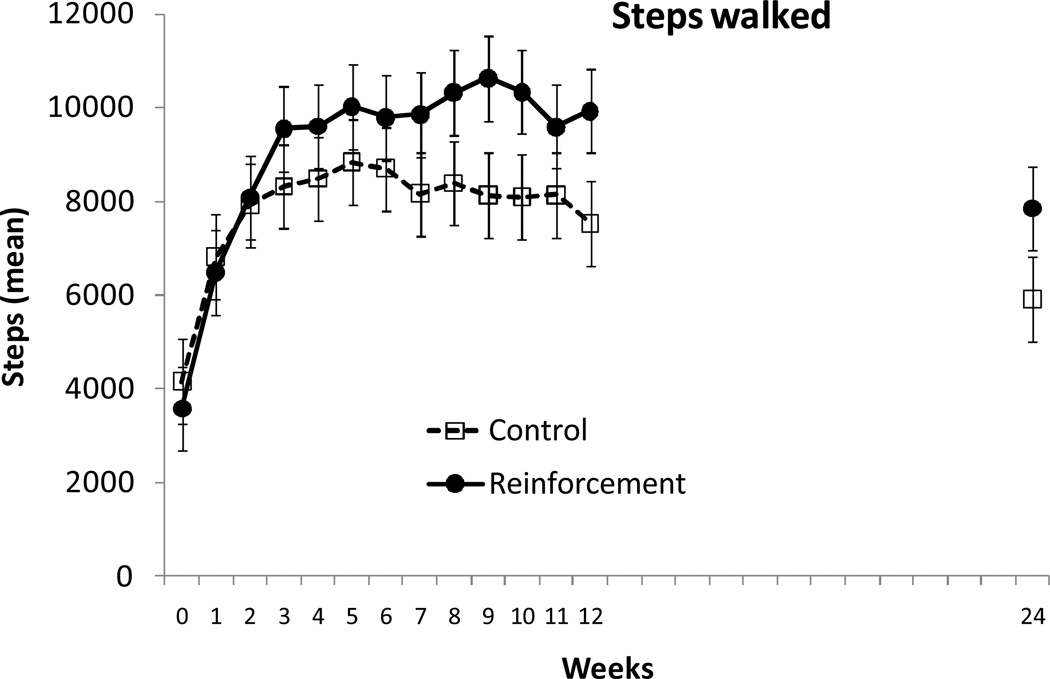
Figure 2.
Average steps per day. Data are plotted for mean steps per day in the week before treatment, throughout each of the 12 weeks of the treatment period, and in the week preceding the 24-week follow-up evaluation. Values represent raw means across the seven days of each one week period. Data from participants assigned to the control condition are shown in open squares, and data from participants assigned to the reinforcement condition are shown in filled circles.

