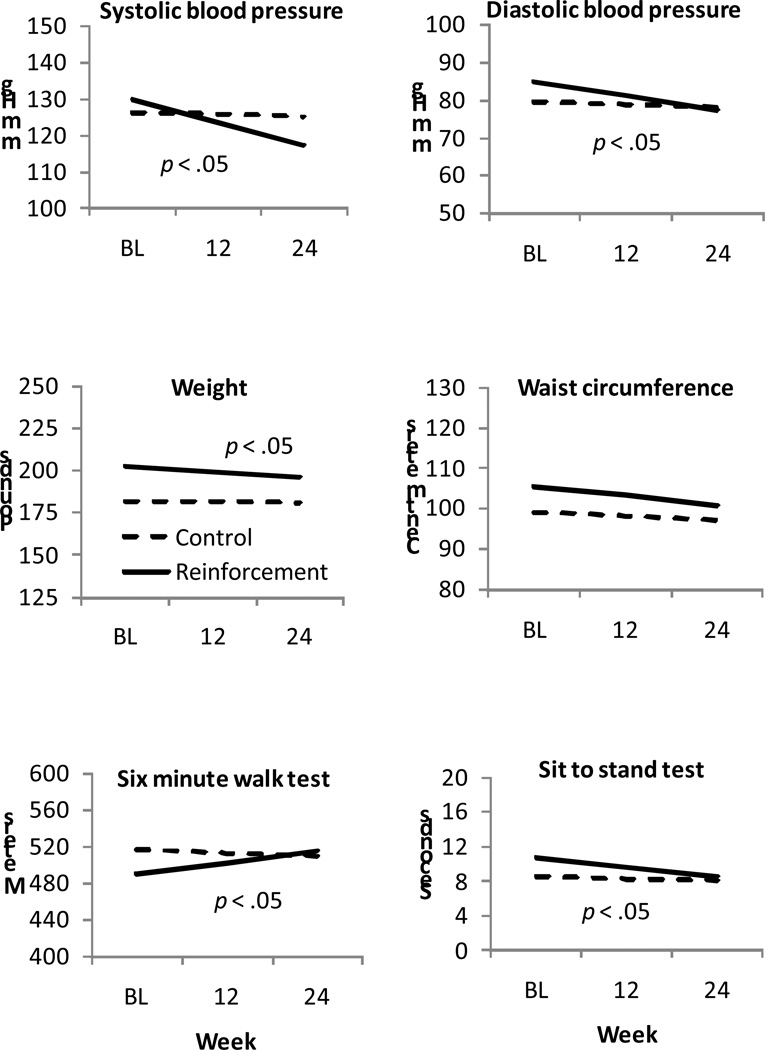
Figure 3.
Physiological assessments and fitness indices over time by treatment condition. Data are derived from hierarchical linear models analyses as described in the text, and represent group means. Data from participants assigned to the control condition are shown by dashed lines, and data from participants assigned to the reinforcement condition are shown by solid lines. The treatment condition by time interaction effect is significant when p < .05.

