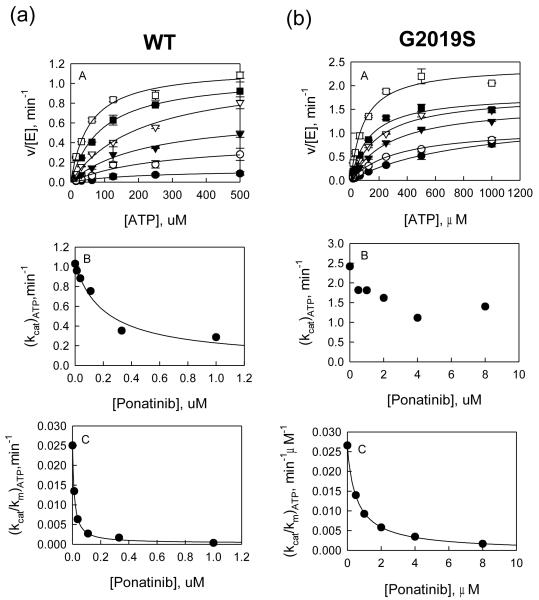
Figure 1.
(a) Inhibition study of wt LRRK2 catalyzed phosphorylation of LRRKtide by Ponatinib. A: Plot of initial velocities vs [ATP] at [Ponatinib] = 1 (●), 0.3 (엯), 0.1 (▾), 0.04 (▿), 0.1 (∎), and 0 μM (□) all at a fixed LRRKtide concentration of 50 μM. B & C: Ponatinib concentration dependencies of (kcat)ATP and (kcat/Km)ATP apparent values derived from analysis of the data of panel A. (b) Inhibition study of the G2019S mutant catalyzed phosphorylation of LRRKtide by Ponatinib. A: Plot of initial velocities vs [ATP] at [Ponatinib] = 8 (●), 4 (엯), 2 (▾), 1 (▿), 0.5 (∎), and 0 μM (□) all at a fixed LRRKtide concentration of 50 μM. B & C: Ponatinib concentration dependencies of (kcat)ATP and (kcat/Km)ATP apparent values derived from analysis of the data of panel A.

