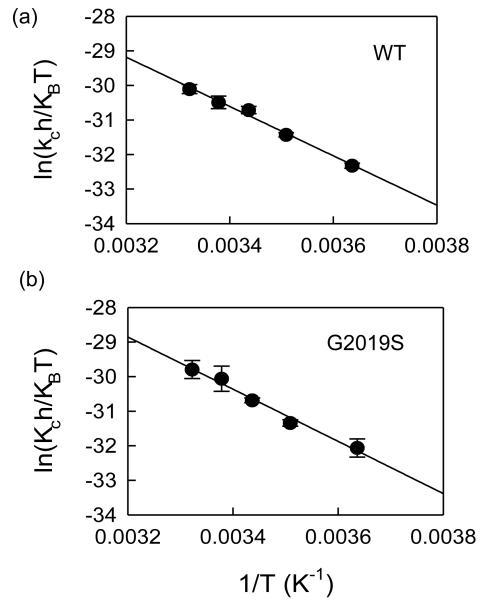
Figure 2.
Temperature dependencies for WT LRRK2 and mutant-catalyzed LRRKtide and LRRKtideS phosphorylation. The Eyring plots show kcat dependence of temperature for WT LRRK2 (a), the mutant G2019S (b). The kcat was the average of four independent measurements. The data from these plots are summarized in table 1.

