
Figure 7.
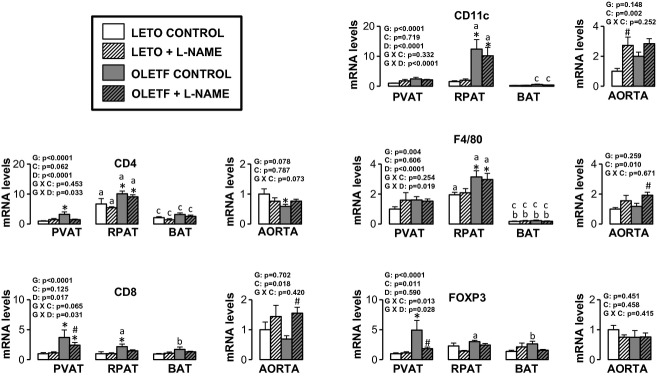
Expression of immune cell‐related genes in AT and aorta of LETO and OLETF rats chronically treated without and with L‐NAME. Values are fold difference in mRNA and expressed as means ± SE. PVAT in the LETO control group of rats is used as the reference tissue and set at 1 for all AT comparisons. For aorta comparisons, the LETO control is used as the reference group and set at 1. *Difference (P < 0.05) from LETO rats; #Difference (P < 0.05) from control rats; aDifference (P < 0.05) between PVAT and RPAT; bDifference (P < 0.05) between PVAT and BAT; cDifference (P < 0.05) between RPAT and BAT. G, group; C, condition; D, fat depot.