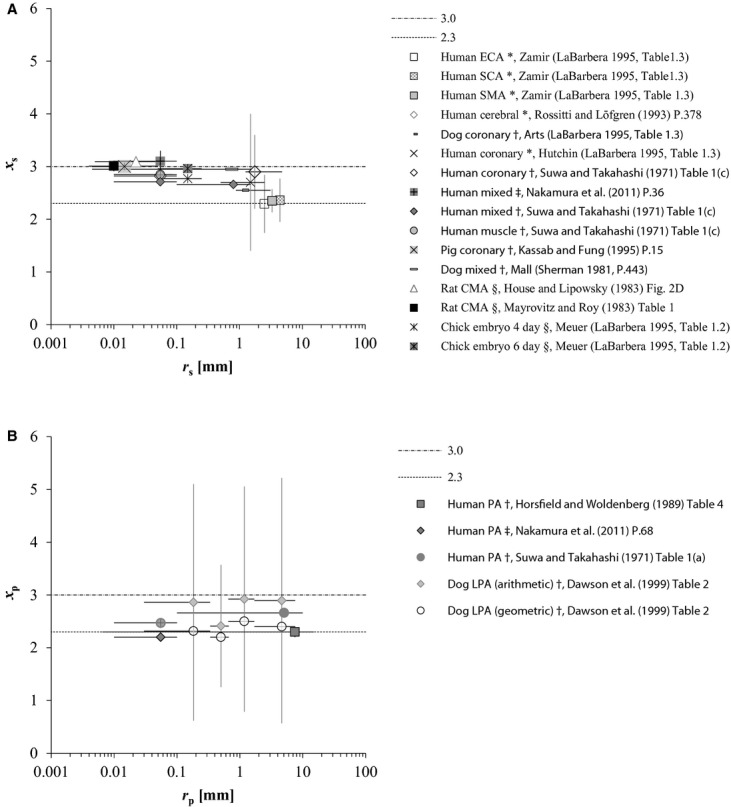
Figure 1.

(A) Distribution of reported xs in a variety of animals by previous studies through various methods, all of which, except for Meuer's data (LaBarbera 1995), are humans (Singhal et al. 1973; Rossitti and Löfgren 1993; LaBarbera 1995; Nakamura et al. 2011) and mammals (Sherman 1981; Mayrovitz and Roy 1983; House and Lipowsky 1987; Kassab and Fung 1995). CMA, ECA, SCA, and SMA indicate the cremaster muscle, external carotid, subclavian, and superior mesenteric arteries, respectively. Radii of ECA, SCA, and SMA were estimated from Olufsen et al.'s (2000) table 1 as 2.5, 4.4, and 3.3 mm, respectively; radius of ECA was tentatively substituted for the mean of the minimal radius at the outlet of bilateral common carotid arteries. House and Lipowsky's (1987) result presented in this figure was derived from the volumetric flow of red blood cells. (B) Distribution of reported xp in humans (Suwa and Takahashi 1971; Horsfield and Woldenberg 1989; Nakamura et al. 2011) and dogs (Dawson et al. 1999). PA, pulmonary arterial tree; LPA, left PA. r, vessel radius, presented at the mid‐point with the range because the mean and median were not reported in the literature; x, radius exponent, defined by in equation (1 or 3 and presented as the mean with one standard deviation. Suffixes s and p indicate systemic and pulmonary. Methodology is indicated by symbols: *angiography; †cast morphometry; ‡model analysis with catheter data; §direct measurement in vivo.
