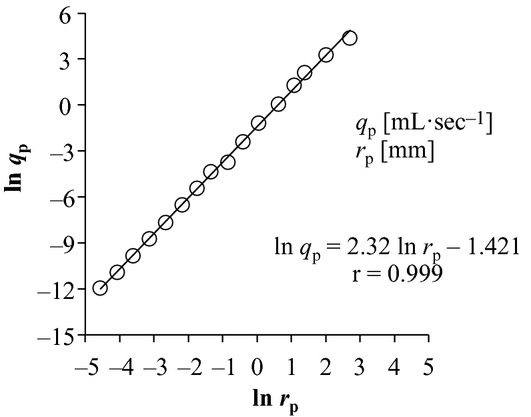
Figure 2.

Ln‐ln plot of human pulmonary arterial blood flow (qp) in a vessel against its corresponding vessel radius (rp). The original data for the plot are derived from combining Singhal et al.'s (1973) tables 4 and 5 under the condition of assumed cardiac output of 4.8 L/min. The slope of this proportionality is equal to radius exponent x. r indicates the correlation coefficient.
