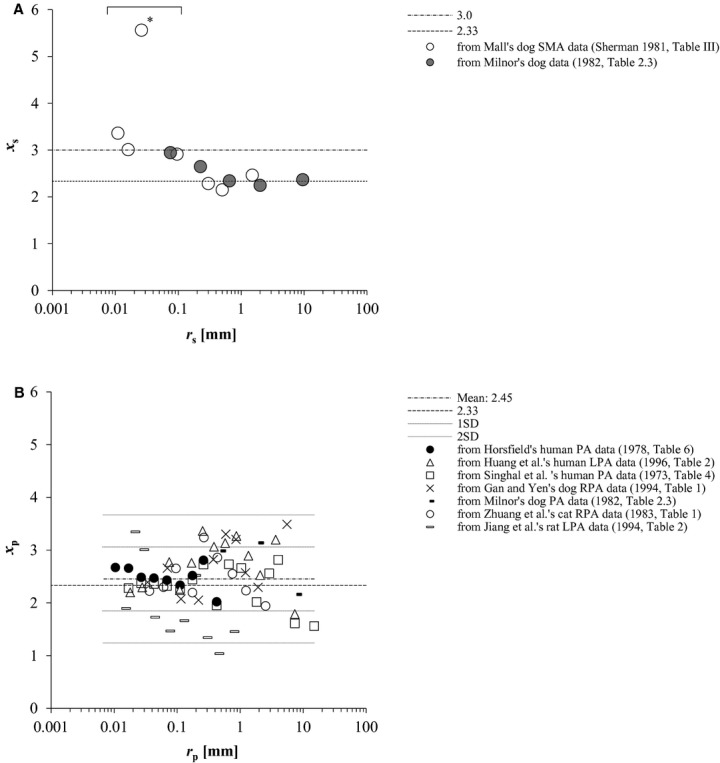
Figure 3.

(A) Plot of estimated xs vs. rs at each arterial generation of systemic arteries of two dogs in the literature (Sherman 1981; Milnor 1982). *indicates the result regarded as an outlier by Q test (P < 0.05) (Böhrer 2008) among the estimates from Mall's data of dog superior mesenteric arteries (SMA) (Sherman 1981) at peripheral systemic arterial area (0.004 ≤ rs ≤ 0.1 mm). (B) Counterparts of pulmonary arteries from three human (Singhal et al. 1973; Horsfield 1978; Huang et al. 1996) and four mammalian data (Milnor 1982; Zhuang et al. 1983; Gan and Yen 1994; Jiang et al. 1994) in the literature. Mean of all estimated xp was indicated together with single and double standard deviations by broken and dotted lines, respectively. PA, pulmonary arterial tree; LPA, left PA; RPA, right PA. r, vessel radius; x, radius exponent, defined by in equation (1 or 3; s, systemic; p, pulmonary.
