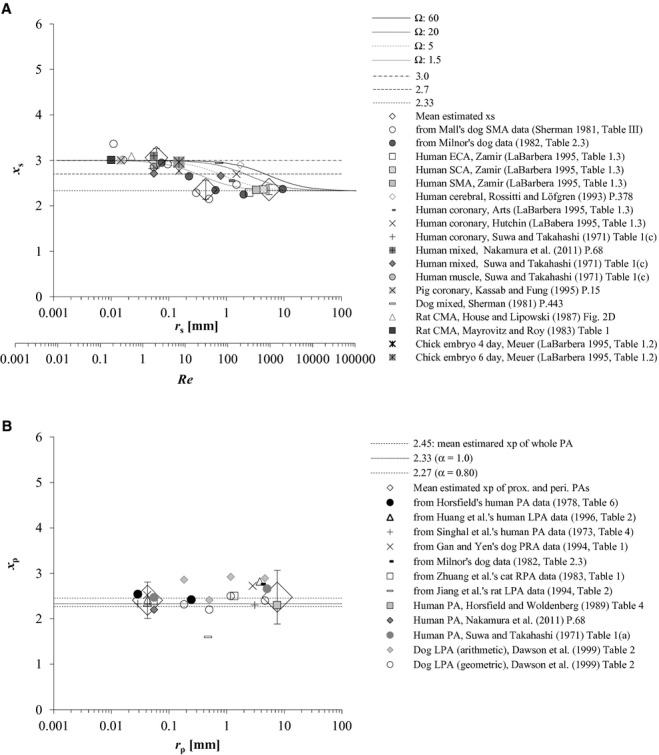
Figure 4.

(A) Comparison between theoretical x from our rigid arterial model and morphometric xs. The model‐derived optimal relationship between the radius exponent x vs. Reynolds number (Re) in a rigid cylindrical artery was also plotted as curves based upon equation 33, which shift to the right with the increment of Ω. Ω represents the proportional coefficient of the vessel length‐radius relationship in equation 17. Both reported mean xs in the literature (Suwa and Takahashi 1971; Sherman 1981; Mayrovitz and Roy 1983; House and Lipowsky 1987; Rossitti and Löfgren 1993; Kassab and Fung 1995; LaBarbera 1995; Nakamura et al. 2011) and those estimated from two dog data in previous studies (Sherman 1981; Milnor 1982) were plotted together against corresponding rs. Mean and one standard deviation (SD) of the estimates were plotted with large rhombuses and outliers, respectively, at proximal (xs, 2.36 ± 0.11; rs, 5.5 mm, range 1.5–9.5 mm), intermediate (xs, 2.36 ± 0.21; rs, 0.44 mm, range 0.23–0.65 mm), and peripheral arterial regions (xs, 3.06 ± 0.21; rs, 0.06 mm, range 0.01–0.10 mm), where Mall's rank 4 (corresponding to our 5th generation) arterial data (Sherman 1981) were excluded as an outlier. CMA, ECA, SCA, and SMA indicate the cremaster muscle, external carotid, subclavian, and superior mesenteric arteries, respectively. (B) Comparison between the elastic arterial model‐derived x and morphometric xp. Means of both reported xp in the literature (Suwa and Takahashi 1971; Horsfield and Woldenberg 1989; Dawson et al. 1999; Nakamura et al. 2011) and those estimated from published data sets (Singhal et al. 1973; Horsfield 1978; Milnor 1982; Zhuang et al. 1983; Gan and Yen 1994; Jiang et al. 1994; Huang et al. 1996) were similarly plotted together against rp. Large rhombuses with outliers indicate the mean of estimated xp with 1 SD at proximal (xp, 2.48 ± 0.59; rp, 0.67 mm, range 0.11–15 mm) and peripheral arterial regions (xp, 2.41 ± 0.40; rp, 0.06 mm, range 0.01–0.10 mm). PA, pulmonary arterial tree; LPA and RPA, left and right pulmonary arterial trees, respectively; prox., proximal; peri., peripheral. r, vessel radius, presented as the mid‐point and its range for the same reason as described in the legend of Figure 1; x, radius exponent, defined by in equation (1 or 3; s and p, systemic and pulmonary, respectively.
