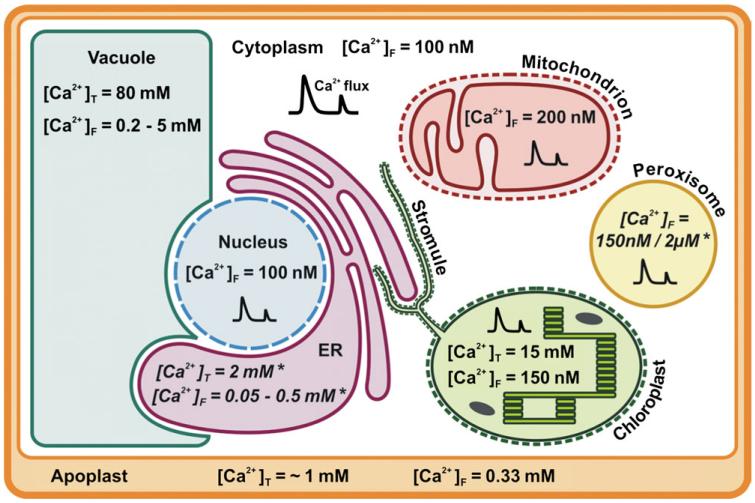
Fig. 1. Summary of organellar Ca2+ concentrations in the plant cell.
Values for reported total ([Ca2+]T) and free resting ([Ca2+]F) Ca2+ concentrations in the different organelles (apoplast, cytoplasm, vacuole, nucleus, ER, chloroplast, mitochondrion, and peroxisome) that were mentioned in the text are depicted here. The values are approximate values and probably vary depending on the tissue or plant species, but nevertheless they provide a general impression of Ca2+ levels across the cell. For ER and peroxisomes, no data on Ca2+ concentration in plants are available. The given values are taken from the animal field and marked with an (*). Calcium fluxes are illustrated by a double peak-shaped symbol ( ).
).

