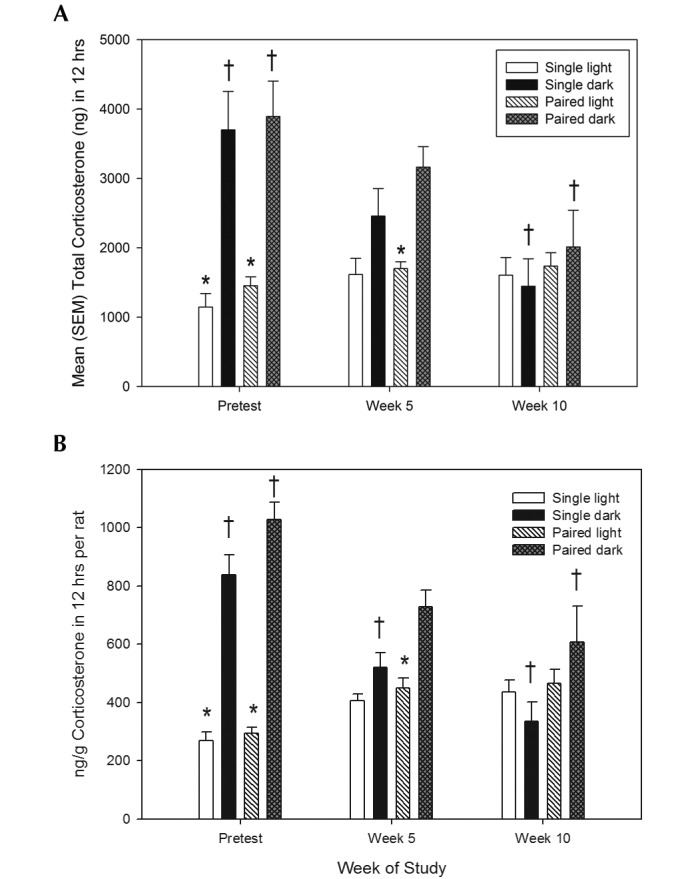
Figure 4.

(A) Total CORT levels during 12-h light or dark period in single and pair-housed male Sprague–Dawley rats. (B) CORT levels relative to fecal output 12 h in single and pair-housed male Sprague–Dawley rats. *, Within-group differences (α = 0.05) between light-and dark-phase total fecal corticosterone levels; †, within-group differences (α = 0.05) in dark-phase CORT levels between test (week 5 or 10) compared with pretest levels.
