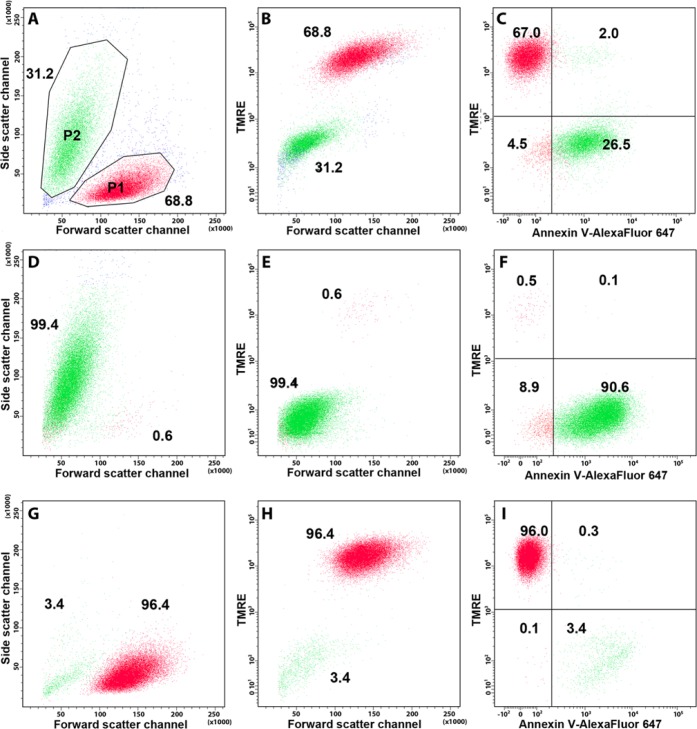
Figure 5.
Discrimination of viable, apoptotic, and late apoptotic/necrotic cells using TMRE (green), Sytox Blue (blue) and Annexin V-Alexa Fluor 647 (red). (A) Apoptotic (red) and viable (green) unsorted Jurkat cell populations defined by light scattering. (B) Apoptotic and viable unsorted Jurkat cell populations defined by TMRE staining. (C) Apoptotic and viable unsorted Jurkat cell populations defined by TMRE and Annexin V-Alexa Fluor 647 staining. (D) Sorted TMRElow cell population, defined by light scattering. (E) Sorted TMRElow cell population, defined by TMRE staining and forward scatter. (F) Sorted TMRElow cell population, defined by TMRE and Annexin V-Alexa Fluor 647 staining. (G) Sorted TMREhigh cell population, defined by light scattering. (H) Sorted TMREhigh cell population defined by TMRE staining and forward scatter. (I) Sorted TMREhigh cell population, defined by TMRE and Annexin V-Alexa Fluor 647 staining. Numbers show the percentage of cells in each population (A, B, D, E, G, H) or in quadrants (C, F, I). Red and green dots correspond to the events depicted in the respective FSC/SSC plots in the regions P1 and P2.

