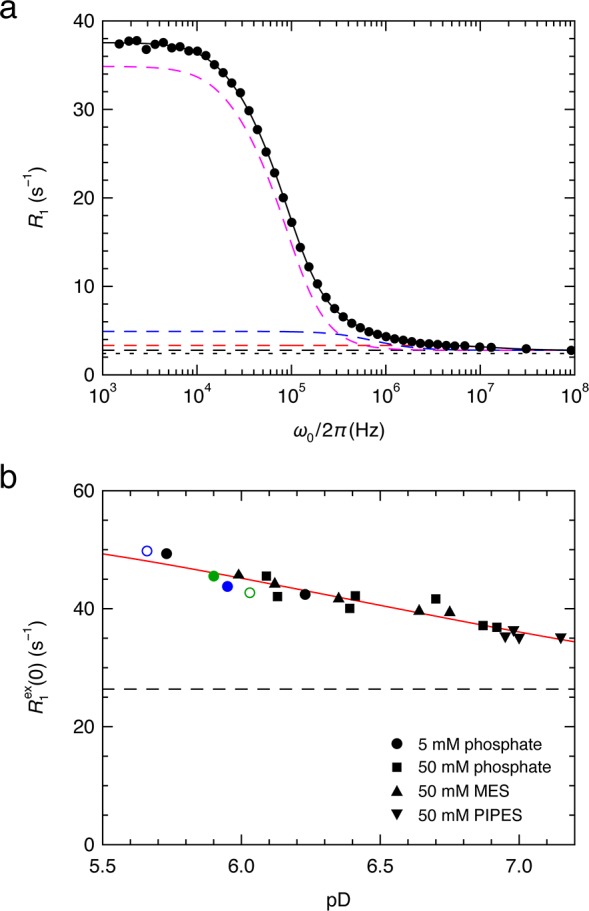
Figure 2.

(a) 2H MRD profile, R1(ω0), from immobilized MbCO at 25 °C, pD 7.0, and NGA = 29.9, scaled to NW = 3 × 10⁴. The error bars do not exceed the symbol size. The solid curve is the fit that resulted in the parameter values in Table 1. The dashed curves are dispersion components 1 (magenta), 2 (blue), and 3 (red). The bulk water (black dotted) and external hydration shell (black dashed) contributions are also shown. (b) Zero-frequency excess relaxation rate, R1ex(0), obtained from fits to 22 MRD profiles, versus pD. The red curve is a fit based on the histidine pKa values in Mb, and the dashed line is the deduced pD-independent water contribution. The difference between the two curves hence represents the His LD contribution. Solid black symbols represent different buffer conditions as indicated. Colored symbols refer to different MbCO concentrations: 2.65 mM (green solid circle), 1.35 mM (green open circle), or 1.02 mM (blue solid circle); and NGA: 110 (blue solid circle) or 62.1 (blue open circle). In all other cases, CMb = 1.60–1.67 mM and NGA = 29.7–31.1.
