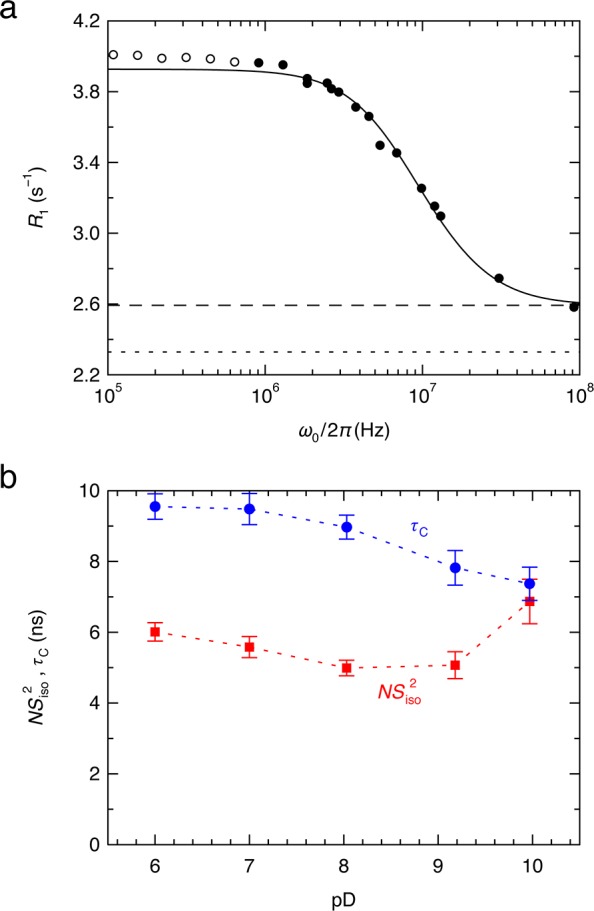
Figure 3.

(a) 2H MRD profile, R1(ω0), from free-tumbling MbCO at 25 °C and pD 7.0, scaled to NW = 3 × 10⁴. The error bars are up to twice the symbol size. The solid curve is a single-component fit to the solid data points (ω0/2π > 0.9 MHz), with the parameters in Table 1. The bulk water (dotted line) and external hydration shell (dashed line) contributions are shown. (b) Amplitude NSiso2 (red squares) and correlation time τC (blue circles), obtained from single-component fits to five MRD profiles, versus pD. The dotted lines are visual guides.
