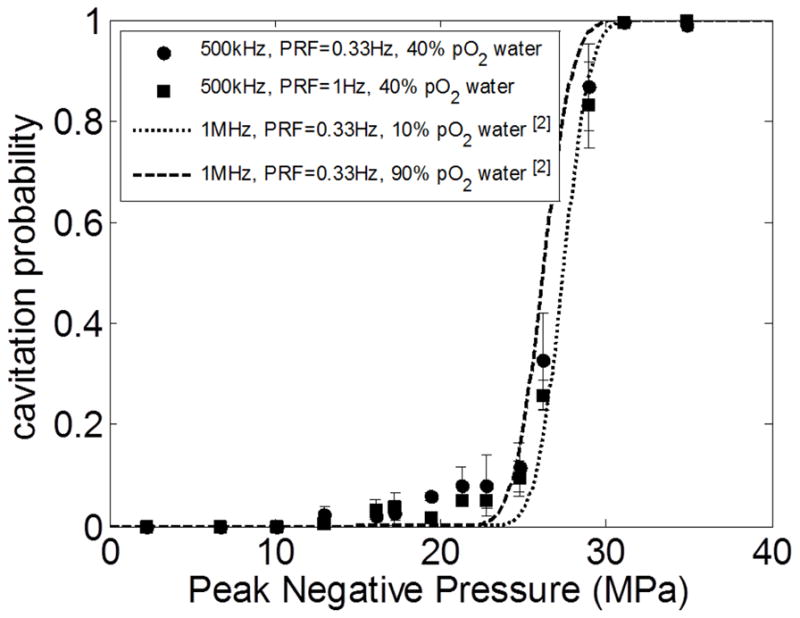
Fig. 3.

The probability for the generation of a dense bubble cloud using a single, short (≤ 2 cycles) pulse. The data from this study (500kHz center frequency transducer in filtered 40% pO2 water) were plotted as solid circles (PRF = 0.33 Hz) and solid squares (PRF = 1 Hz), with vertical error bars indicating one standard deviation. The sigmoidal cavitation probability curves, plotted using the emprical values of pt and σ values determined in the previous study [17] (1 MHz at PRF = 0.33 Hz), are shown as dotted line (distilled 10% pO2 water) and dashed line (unfiltered 90% pO2 water)
