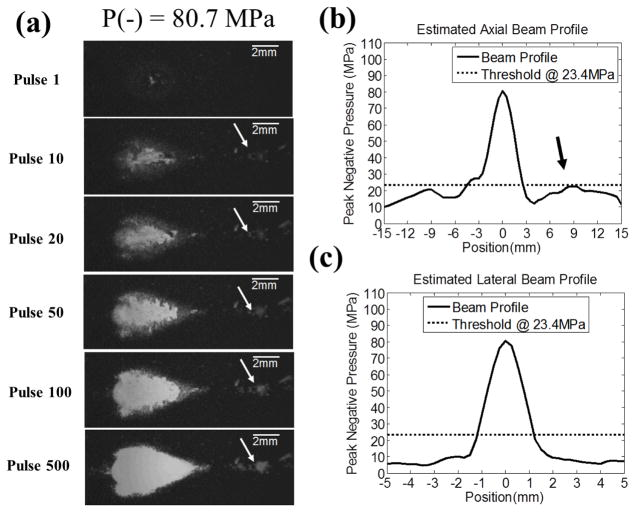
Fig. 7.
The extreme case where P− = 80.7 MPa was applied and one of the grating lobes (post-focal) in the axial direction was close to the threshold for lesion size estimation, PLSE. (a) The representative lesion images in RBC phantom for pulses 1, 10, 20, 50, 100, and 500. These images were taken in the axial-lateral plane of the therapy transducer, and the histotripsy pulses propagated from the left to the right of the image. Collateral damage along axial direction was observed. (b) and (c) 1D estimated axial and lateral beam profiles are plotted as solid lines (–), whereas the dotted lines (...) represents the thresholds at PLSE = 23.4 MPa (for RBC phantoms, see Section E in MATERIALS AND METHODS for the calculation of this value). The 1D beam profiles in (b) and (c) show that one of the grating lobes (post-focal) in the axial direction is close to the threshold (indicated by the black arrow), and this corresponds well with the collateral damage seen in (a) (indicated by the white arrow).

