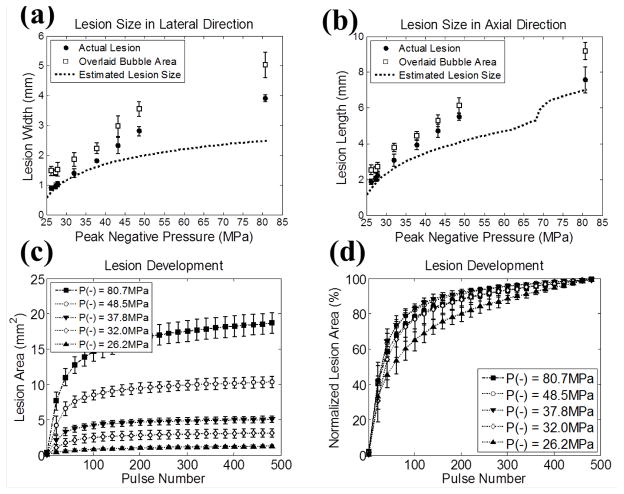
Fig. 8.
The quantified lesion sizes [(a) and (b)] and the lesion development processes [(c) and (d)] as a function of the applied P− in RBC phantom experiments. The sample sizes are nine (N = 9) for each pressure level, and the vertical error bars represent ± one standard deviation. (a) Lesion size in lateral direction. (b) Lesion size in axial direction. Actual lesions are plotted as solid circles (●) and overlaid bubble regions are plotted as empty squares (□). The estimations based on the focal profile regions above the threshold (PLSE = 23.4 MPa for RBC phantoms, see Section E in MATERIALS AND METHODS for the calculation of this value) are plotted as dotted lines (...). (c) The quantified lesion areas in the axial-lateral plane as a function of the number of histotripsy pulses applied. (d) The quantified lesion areas normalized to their maximal extents, at which 500 histotripsy pulses had been applied. The results for different P− values are plotted as follows: 26.2 MPa (...▲...), 32.0 MPa (...◇...), 37.8 MPa (...▼...), 48.5 MPa (...○...), and 80.7 MPa (...■...).

