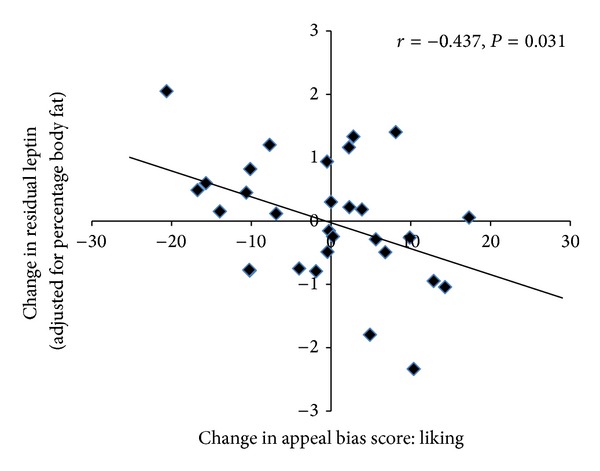
Figure 1.

Scatter plot illustrating the relationship between the change in fasting leptin (adjusted for percentage body fat) following the exercise intervention and the change in appeal bias scores for liking for high fat foods (n = 32). Positive appeal bias = preference for high fat foods > low fat foods. Negative appeal bias score = preference for low fat foods > high fat foods.
