Figure 1.

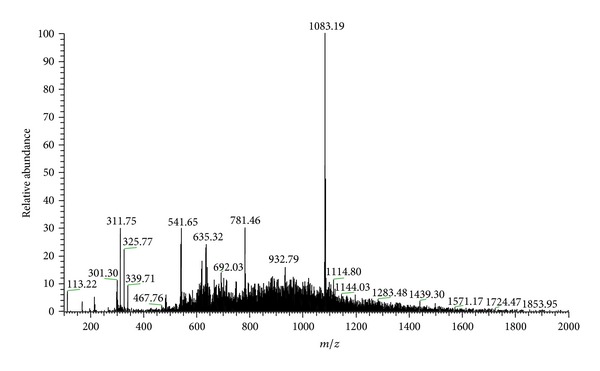
First-order mass spectrum of the hydroalcoholic extract from the leaves of T. catappa in the negative mode. Range of ions with m/z 100–2000 Da.

First-order mass spectrum of the hydroalcoholic extract from the leaves of T. catappa in the negative mode. Range of ions with m/z 100–2000 Da.