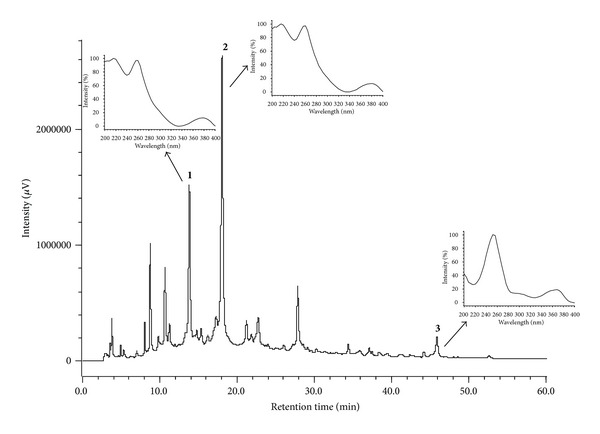
Figure 4.

Chromatogram of infusion of the leaves of T. catappa. Gradient 5–60% MeOH, 60 min, 270 nm. Peaks 1 and 2 = punicalagins, 3 = ellagic Acid. The UV spectra of peak 1, eluting at t r 14.70 min and peak 2 at t r 18.70 min, characteristic of the α- and β-punicalagin anomers. Peak 3, at t r 47.30 min.
