
Figure 5.
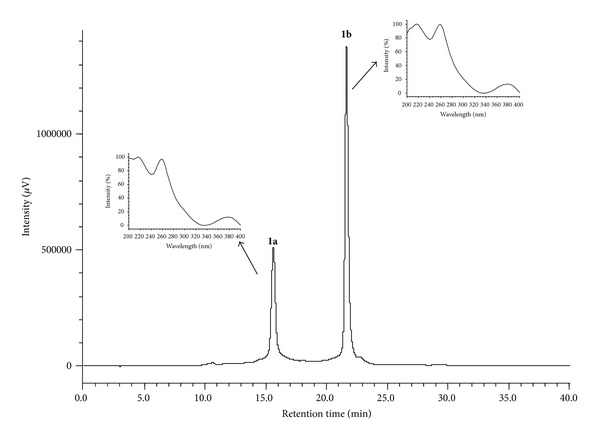
Chromatogram peak 1a (α-punicalagin) and peak 1b (β-punicalagin) collected from H2O : MeOH (8 : 2 v/v) at 10 mg/mL of the leaves of T. catappa, eluting at t r 15.29 min (1a) and t r 21.07 min (1b). The flow rate was 1 mL/min with a gradient 5–30% MeOH for 30 minutes using a hydro column. HPLC-PDA (Jasco), 270 nm. The UV spectra of peak 1, eluting at t r 15.29 min (1a) and at t r 21.07 (1b) min, characteristic of the α- and β-punicalagin anomers.