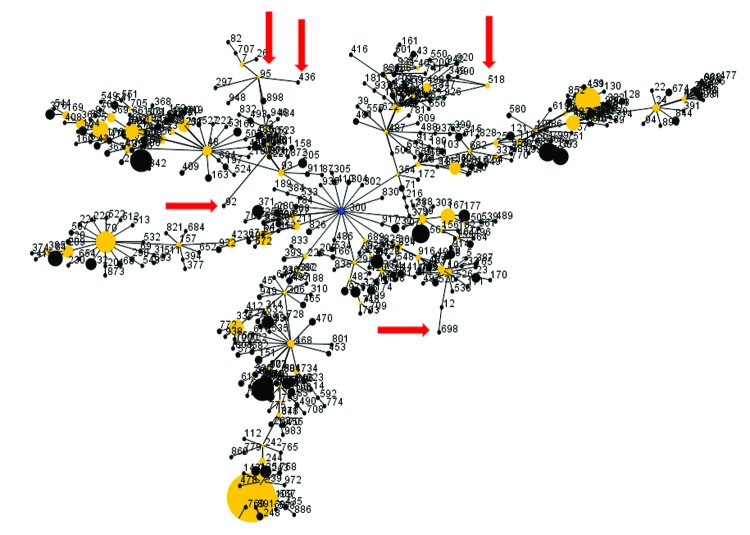
Figure 1.
Diagram of eBURST (3) analysis of multilocus sequence types (STs) of Burkholderia pseudomallei isolates; default settings were used. Dots represent sequence types. Blue dot represents the calculated primary founder, yellow dots represent calculated subgroup founders, and black dots represent the remaining STs. The sizes of dots are proportional to the number of isolates in the database representing a given ST. A single line between sequence types indicates that they are single-locus variants of each other. Red arrows indicate positions of STs associated with isolates from the Western Hemisphere and that are type G according to internal transcribed spacer typing.

