
Figure 1.
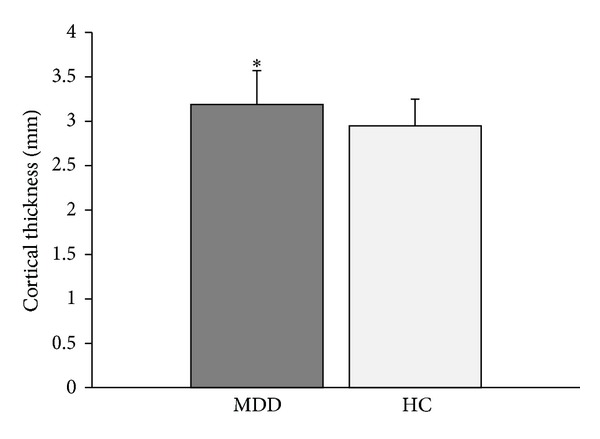
The group with major depressive disorder (MDD) had a thicker frontal pole compared with the healthy control (HC) group (*P = .01).
Official websites use .gov
A
.gov website belongs to an official
government organization in the United States.
Secure .gov websites use HTTPS
A lock (
) or https:// means you've safely
connected to the .gov website. Share sensitive
information only on official, secure websites.
The group with major depressive disorder (MDD) had a thicker frontal pole compared with the healthy control (HC) group (*P = .01).