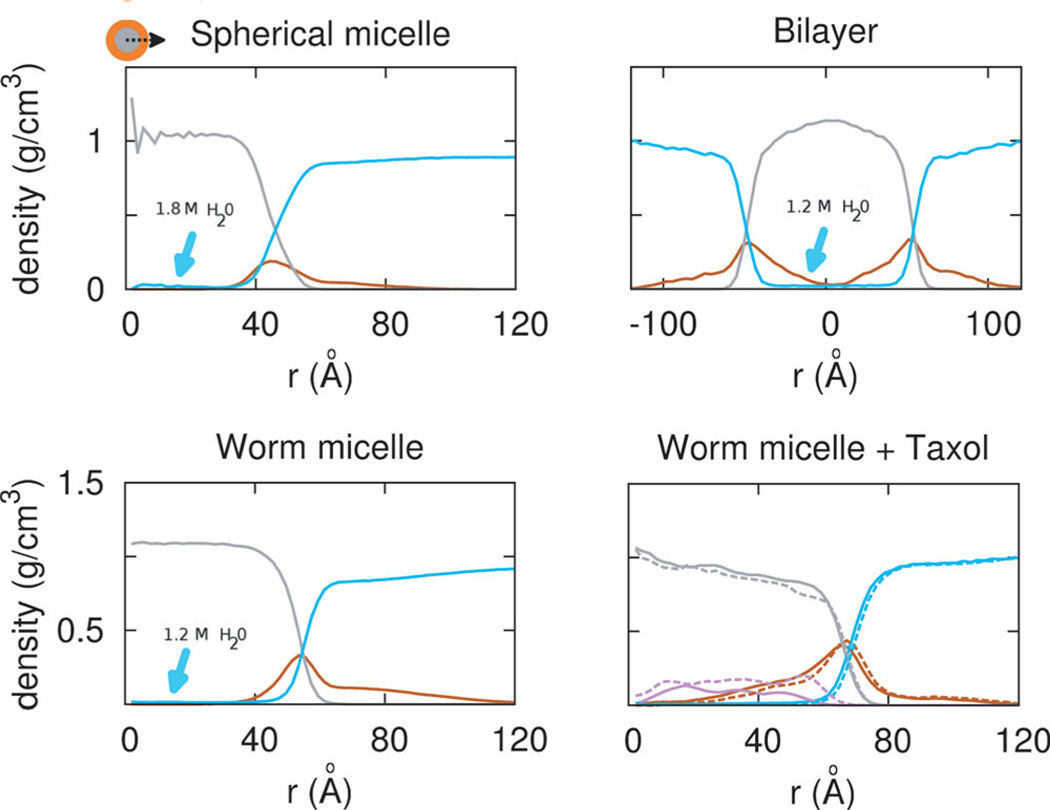
Figure 4.
Morphology dependent density profiles. (from left to right, top to bottom) Sphere of PEG2000–PCL5000,Worm of PEG2000–PCL5000 without and with taxol, and Bilayer of PEG2000–PCL7700. Water (cyan) penetrates into the core of the Sphere moreso than other morphologies. Worm and Bilayer morphology possess a denser PEG corona (orange) at 0.4 g/cm3 than the Sphere. Density in the core (grey) approaches that of a bulk melt of PCL, 1.2 g/cm3. With 3 or 9 wt% Taxol, PEG shifts into the core, and core density decreases. Increasing drug load shifts drug towards the interface.

