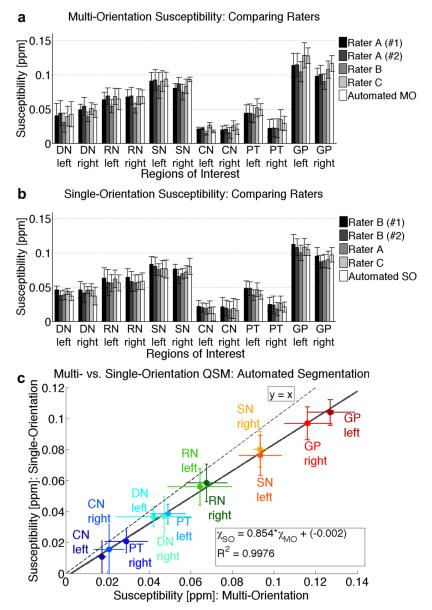
Figure 5.
Deep gray matter magnetic susceptibility values averaged across subjects (n = 5), as determined by the different raters and automated (LDDMM) analysis for susceptibility maps calculated with (a) multi-orientation QSM and (b) single-orientation QSM. (c) Plot of multi-orientation vs. single-orientation susceptibility values shows a linear correlation (inset equation), with the single-orientation LSQR underestimating values from COSMOS, as compared to the line of identity (y = x).

