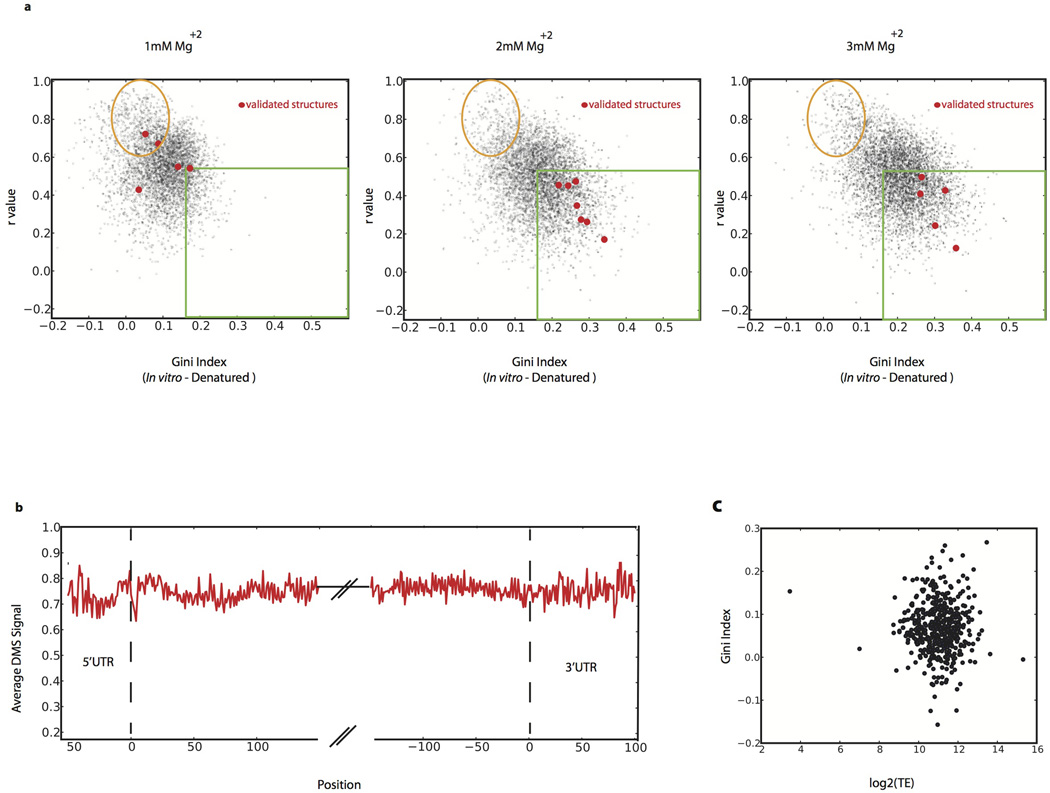
Extended Data Figure 7. Global analysis of mRNA structure.
a, In vitro DMS-seq on RNA re-folded in different Mg+2 concentrations. b, Metagene plot of the average DMS signal (normalized to denatured control) over 5’UTR, coding, and 3’UTR regions. c, Scatter plot of Gini Index (calculated over the first 100 A/C bases) of in vivo messages (relative to denatured) verses translation efficiency.

