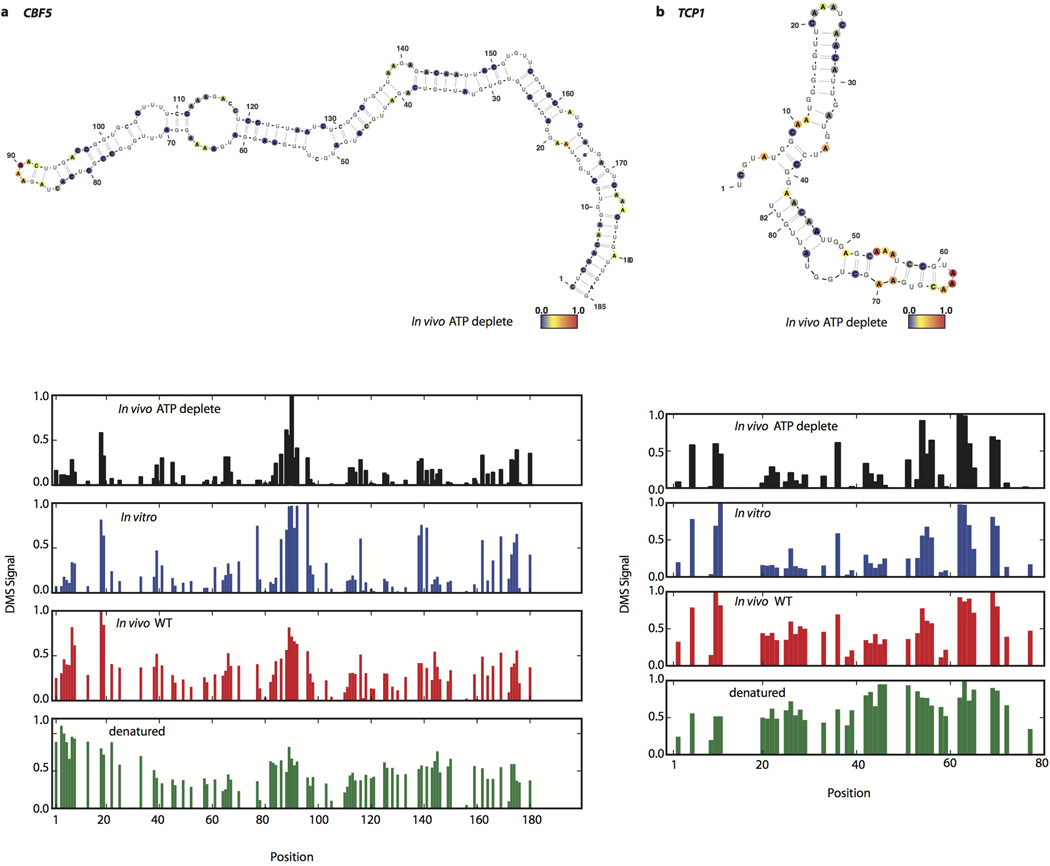
Extended Data Figure 8. In vivo structures forming in ATP depleted conditions.
Raw DMS counts were normalized to the most reactive nucleotide in a given region. The DMS signal is color coded proportional to intensity and plotted onto the mfold predicted secondary structure model of (a) CBF5, nucleotide 1 corresponds to chrXII position 506,479 (b) TCP1, nucleotide 1 corresponds to chrIV position 887,991.

