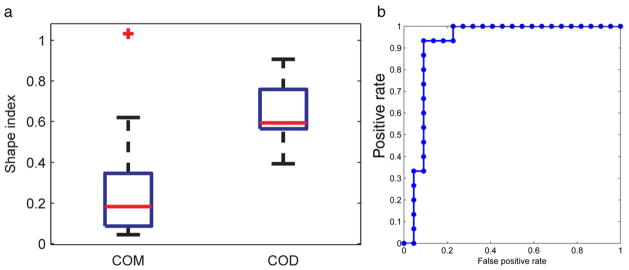
Figure 3.

a, boxplot shows micro-CT data set shape index. Outlier (plus sign) was defined as lower than q1 − 1.5 × (q3 − q1) or higher than q3 + 1.5 × (q3 − q1), where q1 and q3 represent 25th and 75th percentiles (box edges), respectively. Red lines indicate median. Whiskers represent most extreme data points, excluding outlier. b, ROC curve of micro-CT data set differentiating COD and COM stones.
