Figure 5.

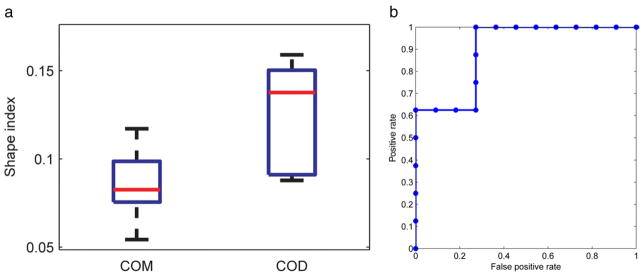
a, boxplot shows patient data set shape index. Red lines indicate median. Box edges indicate 25th and 75th percentiles. Whiskers indicate most extreme data points. b, patient data set ROC curve differentiating COD from COM stones.

a, boxplot shows patient data set shape index. Red lines indicate median. Box edges indicate 25th and 75th percentiles. Whiskers indicate most extreme data points. b, patient data set ROC curve differentiating COD from COM stones.