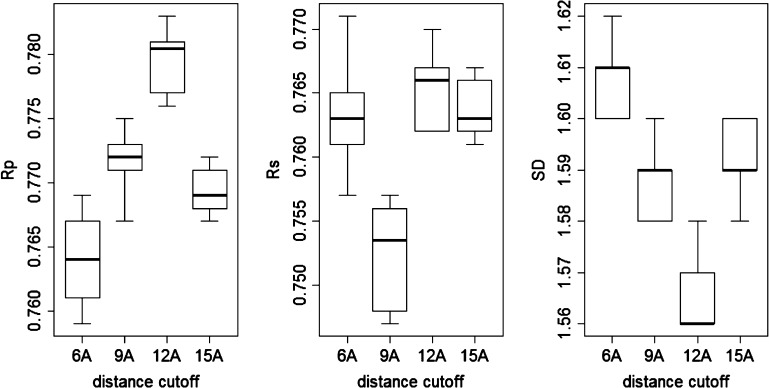
Figure 3.
Test set performance of RF-Score with element descriptors for each of the four distance cutoffs (6 Å, 9 Å, 12 Å, and 15 Å). Performance is measured as the difference between observed and predicted binding affinity in the test set using three metrics: Pearson’s correlation coefficient (Rp; left plot), Spearman rank-correlation coefficient (Rs; middle plot), and standard deviation (SD; right plot). Ten models are built from each of these four versions of the training data sets (6 Å, 9 Å, 12 Å and 15 Å), each time using a different random seed (the boxplot summarizes the performance on the test set achieved by each of the 10 models). Results showed that the best median performance, i.e., that with the highest correlations and lowest standard deviation, is obtained with the 12 Å cutoff in all three performance metrics. It is worth noting that optimizing the distance cutoff only led to a modest performance improvement (+0.017 in median Rp and −0.05 log K units in median SD).

